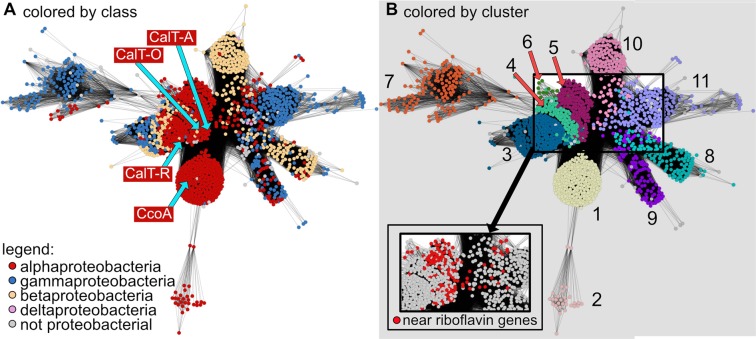
Figure 1.
CcoA-like transporter (CalT) Protein Similarity Network. A protein similarity network of MFS members that are homologous to CcoA is shown. Each node (circle) represents one or more protein sequences, and each edge (solid line) represents similarity between two proteins (threshold set at an alignment score of 75). (A) Nodes are colored by taxonomic classes as indicated. The locations of nodes representing proteins examined in this study are indicated with blue arrows. (B) Nodes are colored by clusters as found in, and numbered according to Fig. 2A. Nodes that represent proteins encoded by genes found near a riboflavin biosynthetic pathway (RBP) cluster are colored red in the pop-out.

