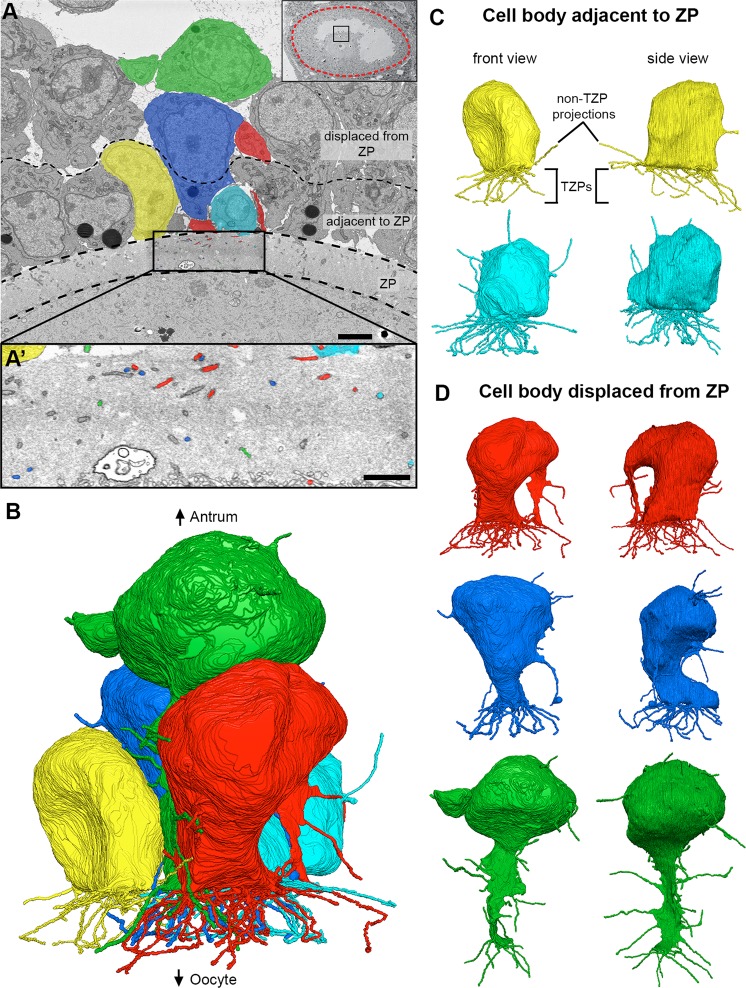
Figure 4.
Directionality of cumulus cell projections. (A) SEM image showing multiple cumulus cell bodies, zona pellucida, and part of the oocyte in cross-section. Five cells (colored) were chosen for reconstruction. Scale bar, 5 μm. Video 1 shows 202 serial sections of this area and highlights the green cell and all of its projections. (A’) High-magnification SEM image of the zona pellucida showing TZPs in cross-section. The colored TZPs originated from the cumulus cells chosen for reconstruction in A. Scale bar, 2 μm. (B) Reconstruction of 5 cumulus cell bodies from (A) and every cytoplasmic projection derived from them. Reconstruction is 28.4 × 24.6 × 18.2 μm (x, y, z), encompassing 405 serial sections (each, 45 nm-thick). A rotating view of this reconstruction can be seen in Video 2. (C,D) Front and side views of reconstructed cumulus cells found directly adjacent to the zona pellucida (C), or displaced by 1–2 cell diameters (D).

