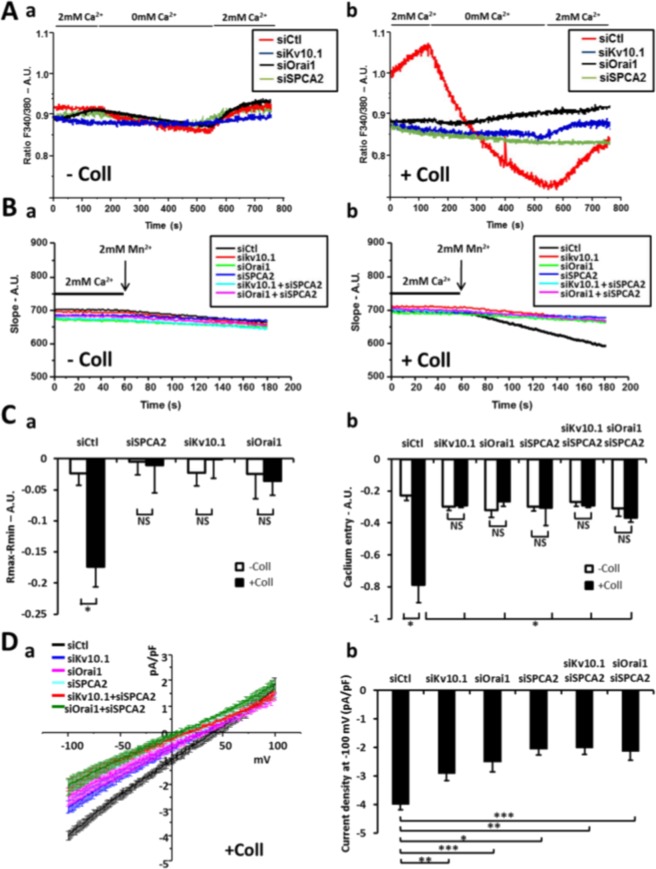
Figure 3.
Collagen 1 induced basal calcium entry rely on Orai1, Kv10.1 and SPCA2 activity. (A) Representatives traces of basal calcium entry imaging of MCF-7 cells after 48 hours of starvation treated (b) or not (a) with collagen 1. (B) Representatives traces of Manganese quench imaging of cells treated (b) or not (a) with collagen 1. Measurements were performed after cells were starved for 48 h (C) (a) Histograms representing the averages ± standard error of basal calcium entry (−Coll: n = 90 siCtl, n = 104 siSPCA2, n = 61 siKv10.1, n = 74 siOrai1; +Coll: n = 118 siCtl, n = 86 siSPCA2, n = 76 siKv10.1, n = 69 siOrai1, N = 3; *p < 0.05, ANOVA followed by Holm-Sidak post hoc tests). (b) Histograms representing the averages ± standard error of slope values obtained in Manganese quench experiences. (−Coll: n = 104 siCtl, n = 83 siSPCA2, n = 88 siKv10.1, n = 72 siOrai1, n = 91 siSPCA2-Kv10.1, n = 85 siSPCA2-Orai1; +Coll: n = 96 siCtl, n = 71 siSPCA2, n = 77 siKv10.1, n = 87 siOrai1, n = 94 siSPCA2-Kv10.1, n = 98 siSPCA2-Orai1, N = 3; *p < 0.05, ANOVA followed by Holm-Sidak post hoc tests). (D) Patch clamp recordings of basal calcium currents. (a) Whole cell currents recorded in MCF-7 cells after 48 hours of starvation treated with collagen I. Patch-clamp measurements were performed with specific bath solution to record basal calcium currents. 250 msec ramps from −100 mV to +100 mV from a holding potential of −40 mV were applied. Values are reported as mean ± SEM. (b) Histograms representing the averages ± standard error of currents values at −100 mV. siKV10.1 (n = 6); siCtl and siSPCA2-Kv10.1 (n = 5); siOrai1 and siSPCA2 (n = 4); siSPCA2-Orai1 (n = 3); *p < 0.05, **p < 0.01, ***p < 0.001, ANOVA followed by Tukey post hoc tests.

