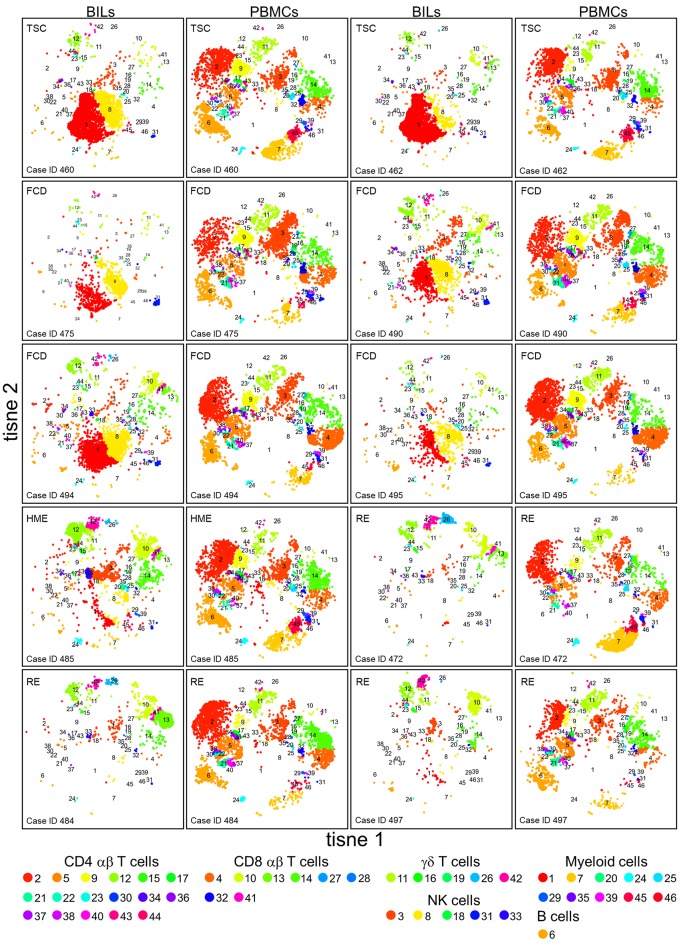
Figure 1.
tSNE plots showing the relative number of different immune cells in BILs and PBMCs from the pediatric epilepsy surgeries. The expression of 20 immune cell markers was analyzed by CyTOF. To define subsets of CD45+ cells in each BIL and PBMC population, the entire high dimensional dataset (comprising 20 FCS files) was converted into a matrix of pair-wise similarities by implementing the t-based stochastic neighbor embedding (t-SNE) algorithm, followed by a density-based clustering method (ClusterX). The clusters were assigned as either T cells, NK cells, myeloid cells, or B cells based on the median expression values of specific immune cell markers (CD3, CD4, CD8, TCR γδ, CD11b, CD56, and CD19).

