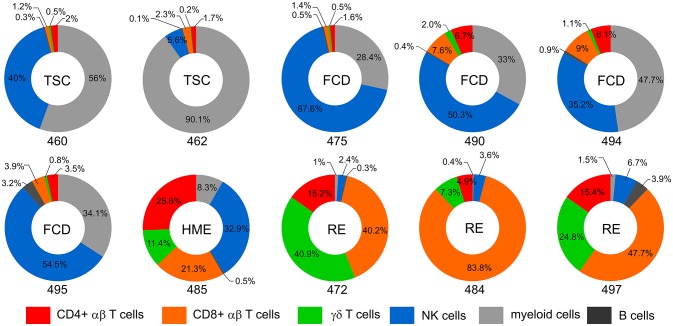
Figure 4.
Immune cell profiles of BILs. Donut plots show the relative number of lymphoid cells, myeloid cells and B cells in the BIL fractions isolated from resected brain tissue. Lymphoid cells are divided into CD4, CD8, and γδ T cells and NK cells. Each chart corresponds to one of the surgery cases, and are arranged according to the clinical diagnosis (TSC: 460, 462; FCD: 475, 490, 494, 495; HME: 485; RE: 472, 484, 497). The data are presented as percentages of the number of CD45+ cells in each BIL fraction.

