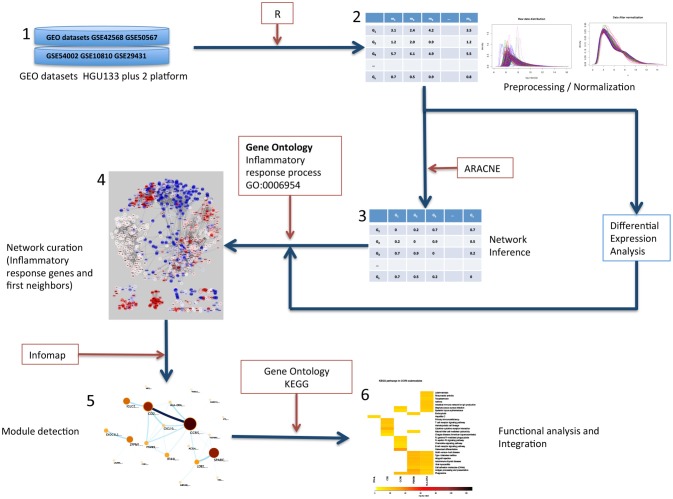
Figure 1.
Graphical description of the methods followed in this work. (1) Gene expression datasets from GEO were selected. All datasets contained normal tissue samples and primary, untreated tumor samples. (2) Datasets were preprocessed, merged and normalized to obtain an expression matrix (Rows correspond to genes and columns correspond to samples). (3) Tumor samples expression matrix was used to calculate all statistical dependencies with the MI function between pairs of genes to construct the network. (4) The network was filtered to obtain the top 10,000 interactions ranked by MI value of genes in the inflammatory response process and first neighbors. (5) The inflammation network was analyzed to detect modules via the Infomap algorithm. (6) The resulting modules were tested for functional enrichment of Gene Ontology.

