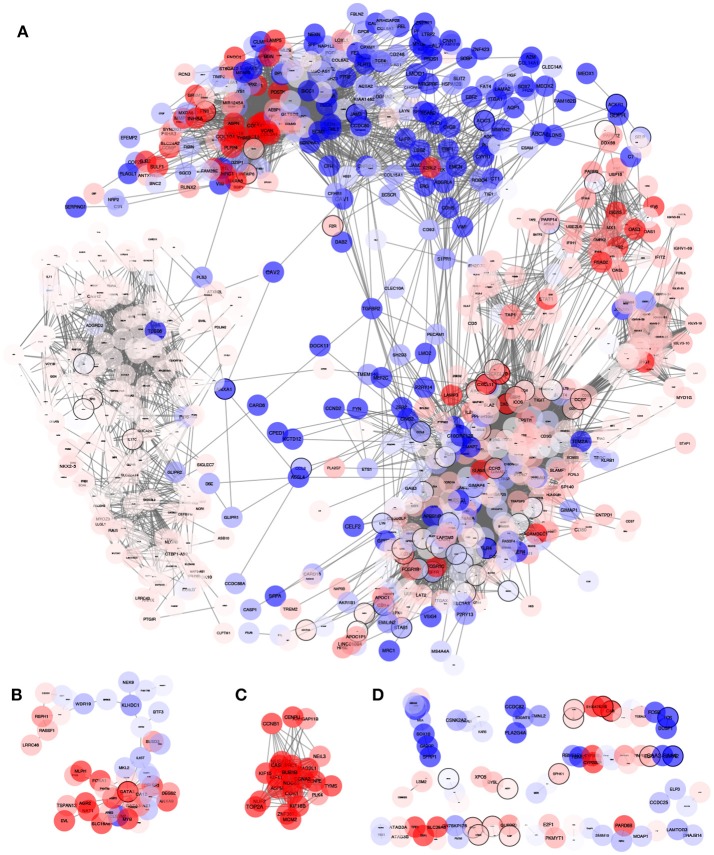
Figure 2.
Network obtained from the MI highest interactions between inflammatory process genes and their first neighbors. The network consists of 942 genes and 10,000 interactions (edges). Node color represent the differential expression status compared to healthy mammary tissue. Red: Overexpressed, Blue: Underexpressed, White or pale color means no differential expression (−1≥LogFch ≤ 1). This network consists of many connected components of which three of them (A–C) consists of more than 10 genes. Indicated with (D) are small components of less than 10 genes. By observing the way nodes aggregate in the largest component (A), it is evident that the network has an internal modular structure where differential expression levels seem to cluster with similar differential expression trends. We further explored how this network is organized and which known biological processes are being regulated.

