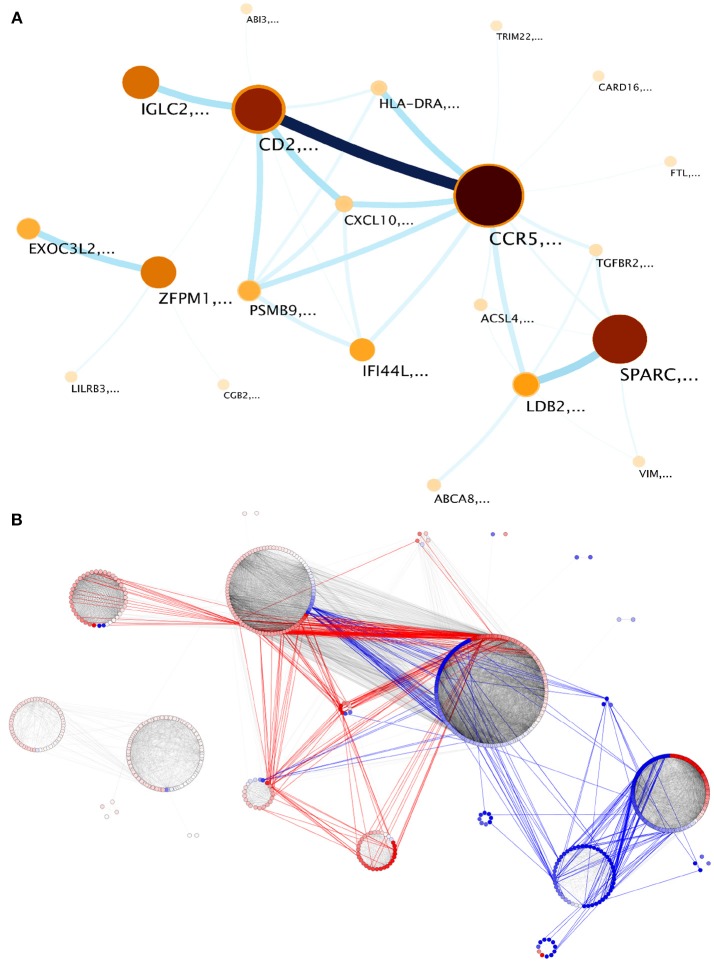
Figure 3.
Modular structure of the largest component of the network. Twenty one submodules were identified. (A) infomap visualization. Nodes correspond to each detected module. Darkest colors and largest circles show those modules with more genes; link widths correspond to the flow between modules, proportional to the inter-module edges. Node labels refer to genes with highest page rank in the module. (B) inter-module edges preferentially link genes with similar expression patterns. Modules are visualized by differential expression. Red links are inter-module edges linking two overexpressed genes, blue links are analogous but regarding underexpressed genes, gray links show intra-module edges and inter-module edges between no-differentially expressed elements.

