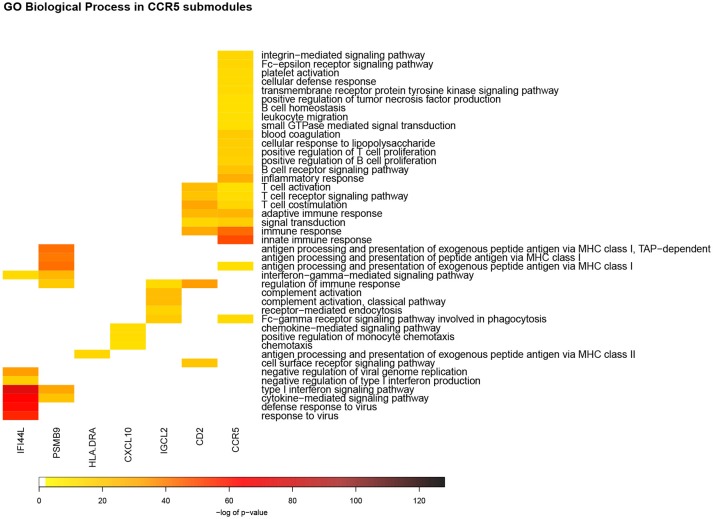
Figure 4.
Heatmap of GO Biological process enrichments for CCR5m submodules. In this representation, each column corresponds to a detected module according to the network structure. Each row is the enriched biological process in the aforementioned modules. The color code represents the enrichment p-value: red color takes account for the most significant values. In this picture can be observed that, despite CCR5sm, each module has a set of unique enriched processes, which could be related to the specificity of functions by each submodule.

