Figure 5.
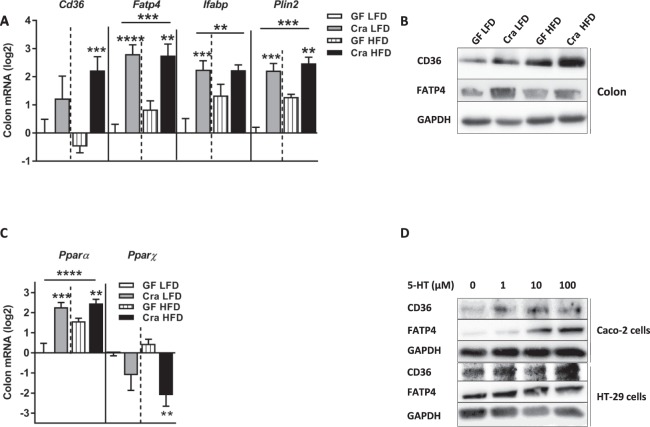
Increased expression of lipid transporters in colon is driven by 5-HT. (A) mRNA levels in colonic tissue of Cra and GF mice after 4 weeks on LFD or HFD determined for cluster of differentiation 36 (Cd36), fatty acids transport protein 4 (Fatp4), intestinal fatty acid binding protein (Ifabp) and perilipin2 (Plin2). (B) Western blot analysis with antibodies specific for CD36 (88 kDa) and FATP4 (72 kDa) in colon from indicated mice. GAPDH (36 kDa) was used as a loading control. (C) mRNA expression of Pparα and Pparɣ in colonic tissue derived from indicated mice. (D) Western blot analysis with antibodies specific for CD36 (88 kDa) and FATP4 (72 kDa) of Caco-2 and HT-29 cells derived proteins after 24 h stimulation with different concentrations of 5-HT. GAPDH (36 kDa) was used as a loading control. (A,C) Bars indicate mean ± SEM log2 fold change compared to mean of LFD-fed GF group. Asterisks above bars indicate statistical differences between Cra and GF mice for each diet group analyzed by Mann-Whitney U test. Differences among all 4 groups were analyzed by Kruskal-Wallis and Dunn’s Post-hoc tests and are indicated by lines. n = 8–13. *p < 0.05; **p < 0.01; ***p < 0.001; ****p < 0.0001. See also Fig. S4.

