Figure 6.
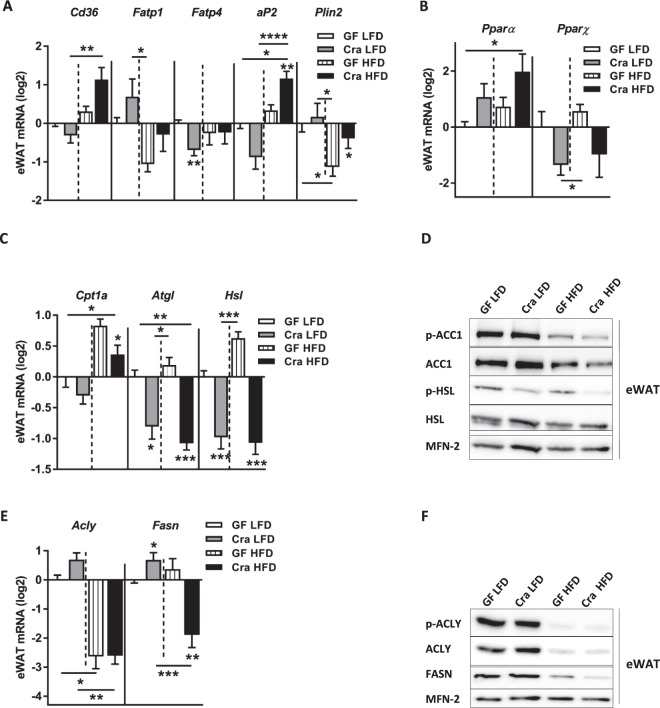
Effect of Clostridium ramosum on lipid metabolism in epididymal white adipose tissue (eWAT) of mice fed HFD. (A) mRNA expression of Cd36, Fatp1, Fatp4, adipocyte Protein 2 (aP2) and Plin2 in eWAT of Cra and GF mice fed either LFD or HFD. (B,C) mRNA expression of PPAR-α, Pparɣ, carnitine palmitoyl transferase I (Cpt1a), adipose triglyceride lipase (Atgl) and hormone sensitive lipase (Hsl) in eWAT of indicated mice. (D) Representative Western blots of eWAT-derived proteins with antibodies specific for p-ACC1 (280 kDa), total ACC, p-HSL (81.83 kDa) or total HSL. MITOFUSIN-2 (MFN-2) (86 kDa) was used as a loading control. (E,F) mRNA and protein abundance of ATP citrate lyase (ACLY) (125 kDa) and fatty acid synthase (FASN) (273 kDa) in eWAT of indicated mice. MITOFUSIN-2 (MFN-2) (86 kDa) was used as a loading control. (A–E) Bars indicate mean ± SEM log2 fold change compared to mean of LFD-fed GF group. Asterisks above bars indicate statistical differences between Cra and GF mice for each diet group analyzed by Mann-Whitney U test. Differences among all 4 groups were analyzed by Kruskal-Wallis and Dunn’s Post-hoc tests and are indicated by lines. n = 8–13. *p < 0.05; **p < 0.01; ***p < 0.001; ****p < 0.0001. See also Fig. S5.

