
Figure 8.
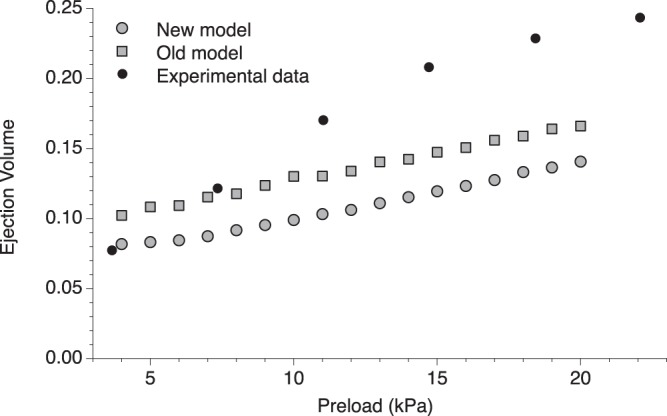
Simulated ejection volume at different preloads (grey circles) and comparison with experimental data40 for rat myocardium (filled dots) and old model (grey boxes). The new model is able to predict an increase in the ejection volume at higher preloads, due to the higher tension generated at longer SLs. However, the increase is not as much as observed experimentally, indicating that other mechanisms are involved in the Frank-Starling law of the heart. More interestingly, the increase in the EV is very similar to the one predicted from our previous model which generates the same Tmax for all SLs (the two simulated data are not superimposed for the intrinsic differences between the models, in the new model the ejection volume at 5 kPa has been chosen for the initial fitting of the FE parameters). This result opens the question about the relative importance of the second component of the LDA in physiological situations.