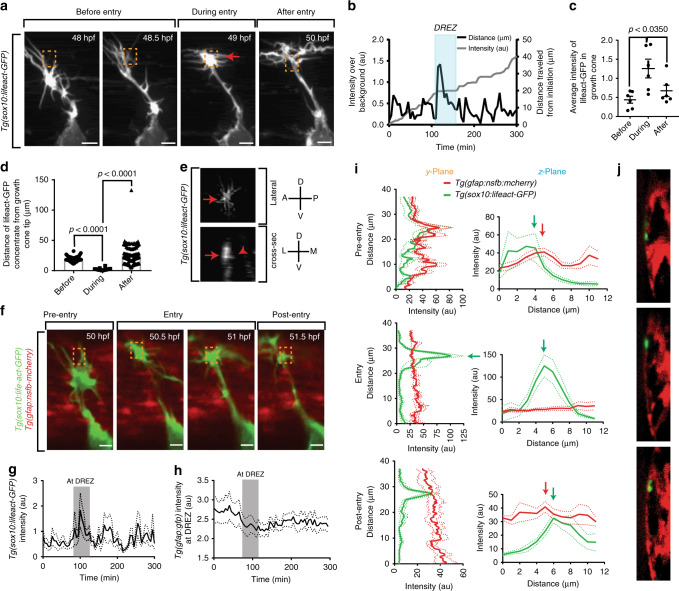
Fig. 3.
An actin-rich structure forms in pioneer axons during spinal entry. a Confocal z-projection frames from a 24-h time-lapse starting at 48 h post fertilization (hpf) of Tg(sox10:lifeact-GFP) zebrafish showing navigation of the pioneer axon into the spinal cord. Actin accumulates in the central growth cone specifically at the dorsal root entry zone (DREZ). Red arrows denote the actin-rich structure at the tip of the growth cone. Orange dotted box denotes DREZ. Entry occurs at 50 min. b Representative intensity profile of Lifeact-GFP at the growth cone (left y-axis, black line) and distance traveled by the growth cone (right y-axis, gray line). Actin concentration specifically occurs during stalling and entry. Shaded blue box denotes the period of axon entry at the DREZ. c Quantification of average intensity of Lifeact-GFP at the growth cone before, during, and after entry to the spinal cord. SEM is shown, n = 6. d Distance of Lifeact-GFP concentrate form the tip of the growth cone before, during, and after entry to the spinal cord. SEM is shown, n = 6. e Deconvolved confocal images of actin-rich structures in Tg(sox10:lifeact-GFP) animals in lateral and cross-sectional views demonstrating the basally projecting actin cluster at the DREZ. Red arrow denotes the same protruding actin concentrate. Red arrowhead denotes basally projecting lifeact-GFP protrusion. Compass shown to right of image denote directional locations on animal. D dorsal, V ventral, A anterior, P posterior, L lateral, M medial. f Confocal z-projection frames from a 24-h time-lapse starting at 48 hpf of Tg(sox10:lifeact-GFP); Tg(gfap:nsfb-mcherry) zebrafish showing navigation of the pioneer axon into the spinal cord. Orange dotted box denotes DREZ. g Intensity profile of Lifeact-GFP at the growth cone. Gray box denotes period of actin concentrate formation. SEM is shown, n = 11 pioneer growth cones. h Intensity profile of Tg(gfap:nsfb-mcherry) at the DREZ. Gray box denotes period of actin concentrate formation in the growth cone. mCherry intensity at the DREZ specifically decreases during actin accumulation in the growth cone. SEM is shown, n = 11 DREZ. i Intensity profiles of Tg(sox10:lifeact-GFP) and Tg(gfap:nsfb-mcherry) across the y- and z-planes of the growth cone in y-orthogonal images before, during, and after entry at the DREZ. The y- and z-planes determined as shown in Fig. 2b. White arrowhead denotes the glia limitans. Black arrowhead denotes the radial glia cell soma. SEM is shown, n = 11 DREZ. j The y-orthogonal images of used to create intensity profiles in (i). Scale bars denote 10 µm. Tukey’s honestly significant difference (HSD) (d)

