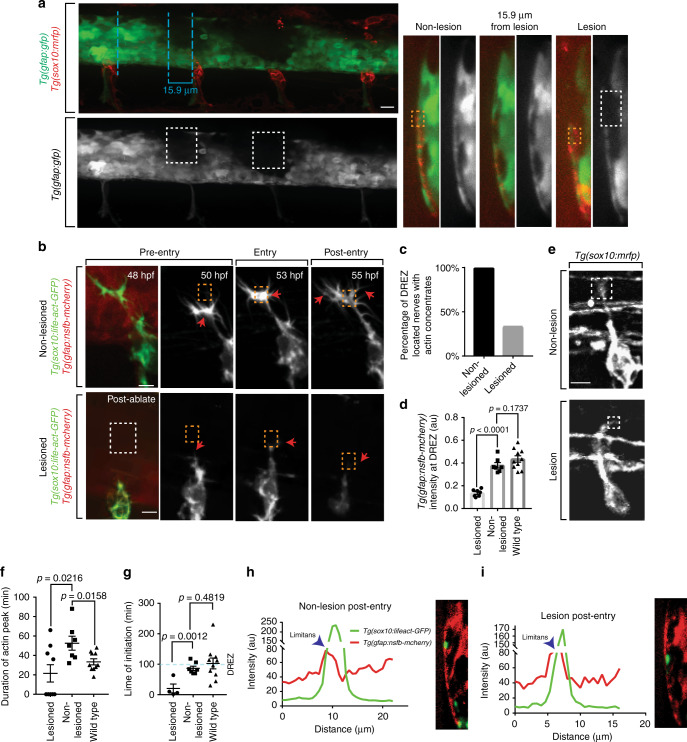
Fig. 4.
Actin-rich structures form to cross a radial glial boundary. a Confocal z-projection image of a Tg(sox10:mrfp); Tg(gfap:gfp) zebrafish after focal lesions at the dorsal root entry zone (DREZ), displaying the mechanism of focal ablations with adjacent, control non-lesioned nerves. Dashed blue lines indicate the plane shown in the y-orthogonal images. Dashed white boxes denote area of lesion. b Confocal z-projection frames from a 24-h time-lapse starting at 48 h post fertilization (hpf) of Lifeact-GFP, Tg(gfap:nsfb-mcherry) zebrafish showing navigation of the pioneer axon into the spinal cord in animals with a lesioned DREZ and a non-lesioned DREZ. Axons with lesioned DREZ fail to form actin concentrates. Red arrows denote the tip of the growth cone. White dotted box denotes the DREZ lesion. Orange dotted box denotes DREZ. c Quantification of DREZ-located axons that form actin-rich structures with a lesioned and non-lesioned DREZ. SEM is shown, n = 9 dorsal root ganglia (DRG) with a lesioned DREZ, n = 8 DRG with a non-lesioned DREZ. d Quantification of relative intensity of Tg(gfap:nsfb-mcherry) at the DREZ in wildtype (n = 10 DRG), lesioned (n = 9 DRG), and non-lesioned (n = 8 DRG) animals. SEM is shown. e Confocal images of a Tg(sox10:mrfp) growth cone during spinal cord entry with a lesioned and non-lesioned DREZ. f Quantification of duration of actin concentrates in wildtype, lesioned, and non-lesioned animals. SEM is shown, n = 10 wildtype animals, n = 8 non-lesioned animals, n = 9 lesioned animals. g Quantification of time of initiation of actin concentrates in wildtype, lesioned, and non-lesioned animals. Dotted blue line denotes when axons approach the DREZ. SEM is shown, n = 10 wildtype animals, n = 8 non-lesioned animals, n = 9 lesioned animals. h Representative intensity profile of Tg(sox10:lifeact-GFP) and Tg(gfap:nsfb-mcherry) through the z-plane of the growth cone and corresponding y-orthogonal image in a non-lesioned DREZ after entry. Measurements collected as described in Fig. 2b. i Representative intensity profile of Tg(sox10:lifeact-GFP) and Tg(gfap:nsfb-mcherry) through the z-plane of the growth cone and corresponding y-orthogonal image in a lesioned DREZ after axon entry. Measurements collected as described in Fig. 2b. Scale bars denote 10 µm. Tukey’s honestly significant difference (HSD) (d, f, g)

