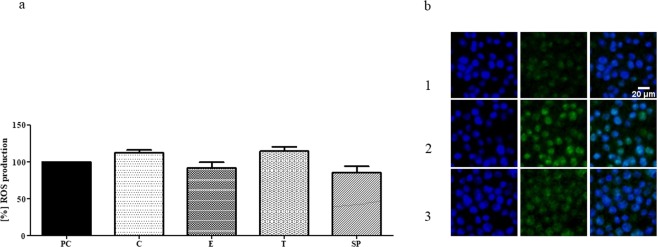
Figure 8.
(a) Macrophage ROS production in the presence of extracts from BC dressings impregnated with PEG - PC; clove oil - C, eucalyptus oil - E, thyme oil - T. SP - spontaneous ROS production by non-treated macrophages. (b) Visualization of macrophage ROS: 1. spontaneous (non-treated) production; 2. LPS-induced ROS production; 3. ROS production induced by extract from BC dressing impregnated with eucalyptus essential oil. Green color - ROS production; blue color - macrophages’ nuclei. Please note that intensity of fluorescence of EO-treated macrophages (at green channel, especially) is similar to this of control sample and lower than of LPS-induced production. Control set: Results are normalized with regard to CP sample which consists of cellulose and oil PEG but does not possess active substances of EOs (values of ROS production for CP was considered 100%).

