
Figure 6.
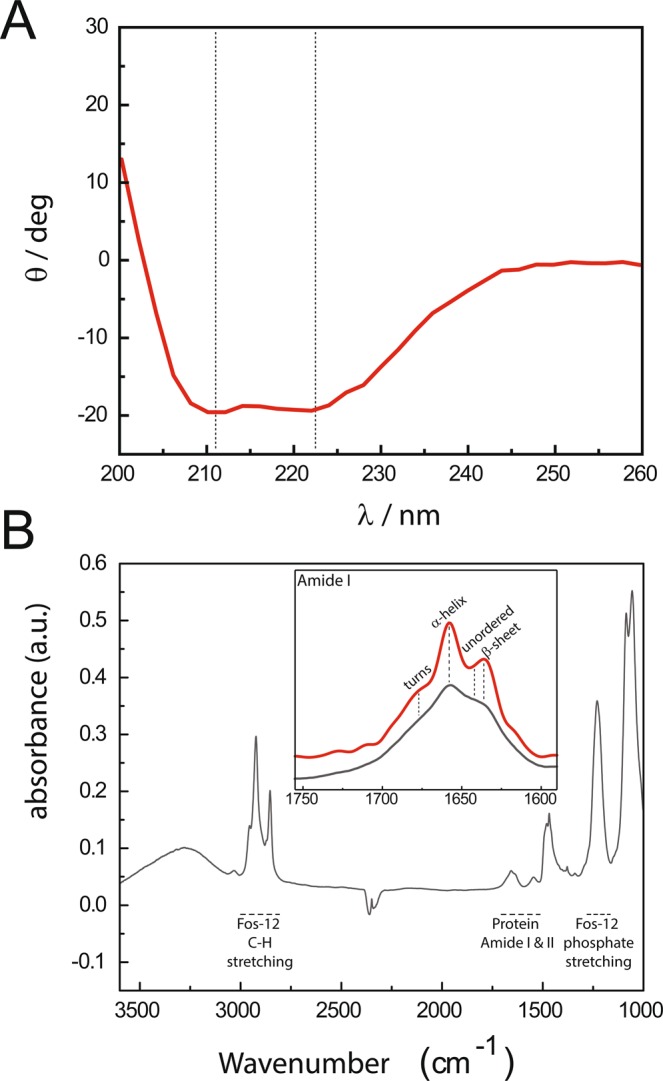
hSGLT1 secondary structure. (A) CD spectrum of WT hSGLT1 at 15 µM in 150 mM TKCL at pH 7.6. (B) FT-IR spectrum of purified WT hSGLT1 in detergent micelles. Complete FT-IR spectrum of WT hSGLT1 after drying it out under N2 stream. Amide I region is magnified and specific regions are represented: (α) α-helix at 1657 cm−1 and (β) β-sheet structure at 1635 cm−1. In black, dry FT-IR spectrum of WT hSGLT1 and, in red, dry FT-IR spectrum after deconvolution.