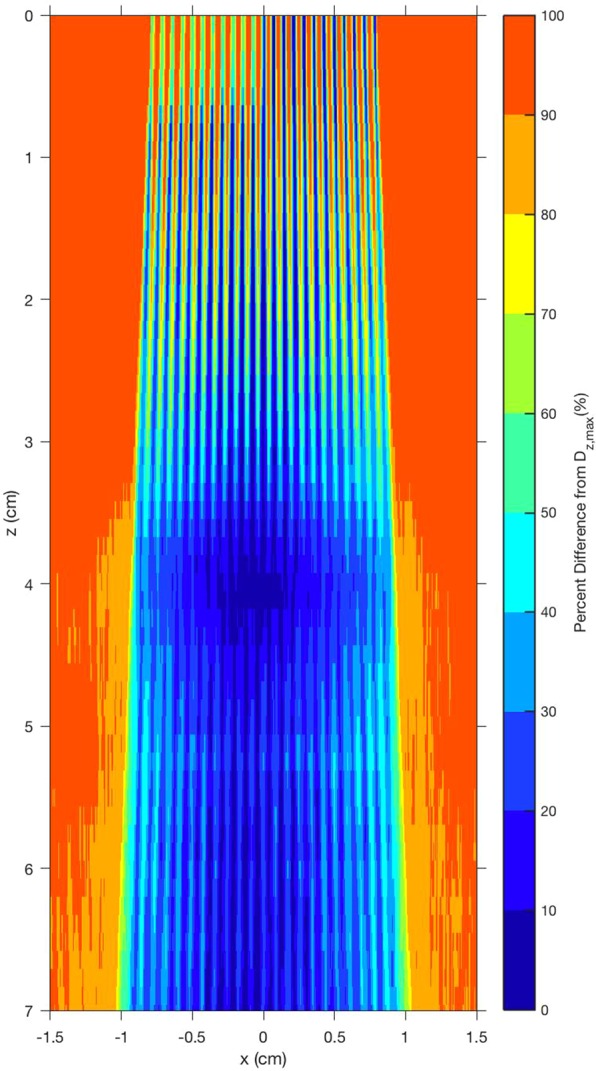
Figure 11.

The local peak-to-valley ratios are quantified as the percent difference between the peak of the local energy deposition and the minimum value, called valley, of the energy deposition for a given depth in the subject. Lower percent difference indicates a region with less relative variation in peak to valley values. The figure reveals a homogenous merge region near 4-cm depth, which is approximately symmetric despite the presence of cortical bone at the surface, which blocked half of the beam at x < 0. As a subtle point, being revealed in both Fig. 10a,b, the measurements would have benefited from the use of a diverging multislit collimator. Such a use would have produced a more uniform lateral dose distribution, producing a “flat” merge depth. The need for the diverging multislit collimator depends on several parameters including the source spot size, the source-to-collimator distance, and the collimator thickness for a given beam thickness and beam spacing.
