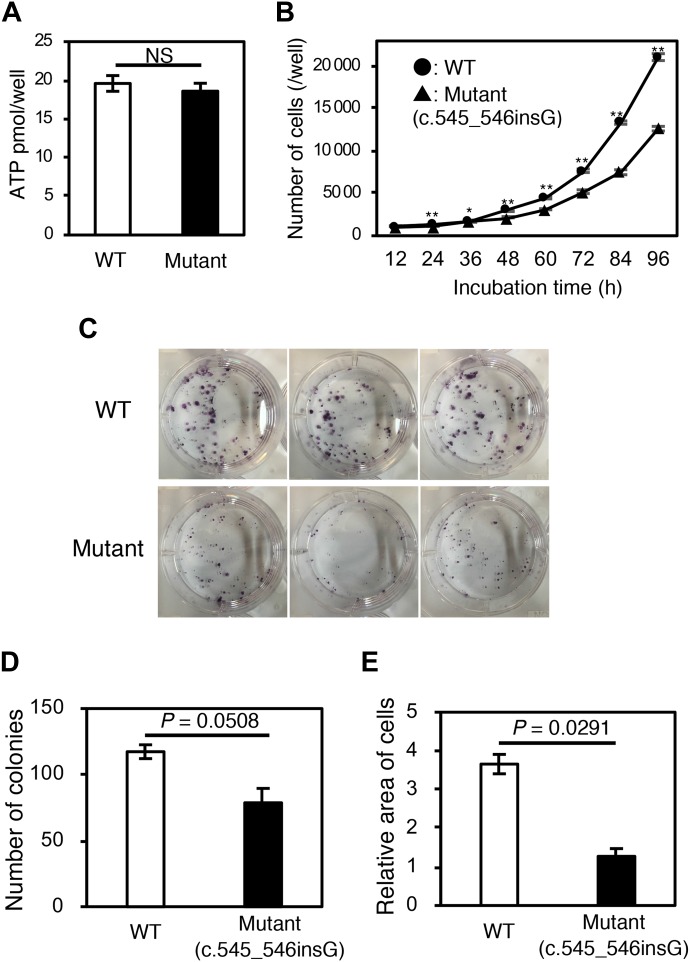
Figure 5. Cell viability, cell proliferation, and colony formation assays.
Flp-In-293 cell lines stably expressing wild-type or mutant LOR were analysed. (A) The ATP-based cell viability assay revealed little difference in cell viability between these cell lines (n = 6). (B) Wild-type cells displayed significantly higher proliferation rates than mutant cells (n = 6). (C–E) Colony formation assay. Wild-type cells formed more colonies than mutant cells, albeit with a borderline statistical significance (n = 3). The area occupied by the wild-type colonies on the culture well surface was approximately 3 times larger than that occupied by the mutant colonies (n = 3). Data indicate mean ± SEM. *P < 0.05, **P < 0.01, P = 0.0508, P = 0.0291 by two-tailed t test.

