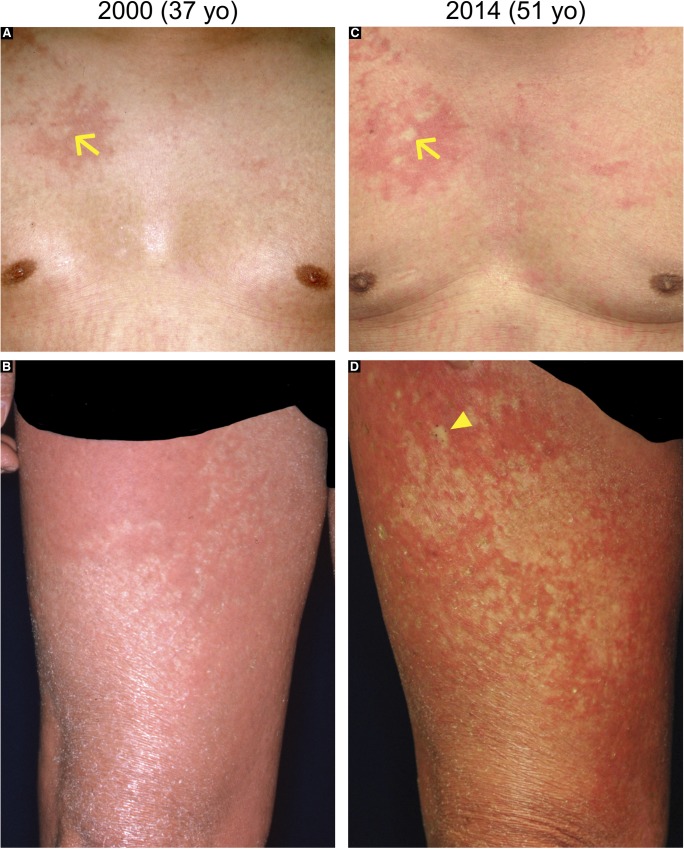
Figure S4. Chronological analysis of revertant spots in the proband in family 1.
Revertant spots in the proband of family 1. A comparison of his clinical images from 2000 (A, B) and 2014 (C, D) revealed that “normal-appearing” patches had increased in both size and number. The arrow and arrowhead indicate two representative patches.

