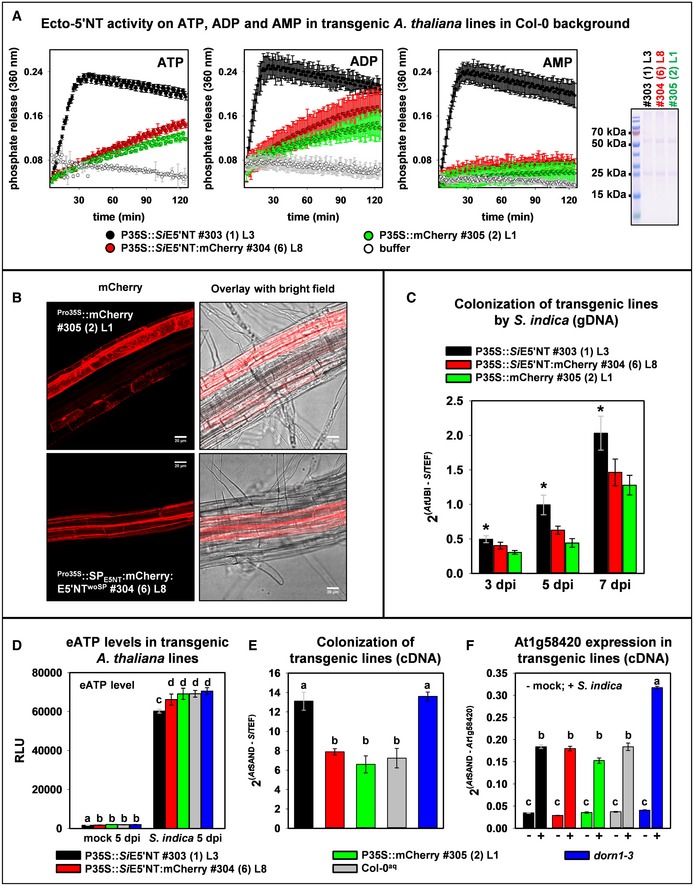
Ecto‐5′‐nucleotidase activity measured in membrane protein preparations of Arabidopsis plants expressing Pro35S::E5′NT (#303), Pro35S::SPE5′NT:mCherry:E5′NTwoSP (#304), or Pro35S::mCherry (#305). E5′NT activity was measured after incubation with 100 μM of either ATP, ADP, or AMP. In the membrane protein preparations from Pro35S::E5′NT (#303) lines, phosphate release was specifically increased upon incubation with purines. Error bars represent the standard error of the mean from three technical repetitions. The Coomassie‐stained SDS–PAGE shows the protein pattern of the membrane fractions for the individual transgenic lines. Equal volumes were loaded. The experiment was repeated two times with similar results.
Confocal microscopy images of Arabidopsis roots expressing either cytosolic mCherry (#305) or Pro35S::SPE5′NT:mCherry:E5′NTwoSP (#304) showing secretion of the E5′NT fusion protein. mCherry images show z‐stacks of 14 image planes of 1 μm each. Scale bar = 20 μm.
The transgenic Arabidopsis line Pro35S::E5′NT (#303) expressing untagged full‐length SiE5′NT was better colonized by S. indica. Error bars of the qPCR data represent ± SE of the mean from three independent biological replicates. Asterisks indicate significance (Student's t‐test, *P < 0.05).
S. indica induced eATP release in different Arabidopsis transgenic lines. Culture medium was collected from mock‐treated or S. indica‐inoculated seedlings growing in liquid medium at 5 dpi, and released eATP was measured. RLU: relative light units. Error bars represent ± SE of the mean from three biological replicates. Letters indicate significance to all other samples within the same treatment group (ANOVA, P < 0.05).
S. indica colonization of transgenic lines at 5 dpi. Error bars represent ± SE of the mean from three biological replicates. Letters indicate significance to all other samples within the same treatment group (ANOVA, P < 0.05).
Expression analysis of the eATP responsive gene At1g58420 measured by qRT–PCR. Error bars represent ± SE of the mean from three independent biological replicates (independent from those shown in Fig.
2C). Letters indicate significant groups (ANOVA,
P < 0.01, for the line 305
P < 0.05).

