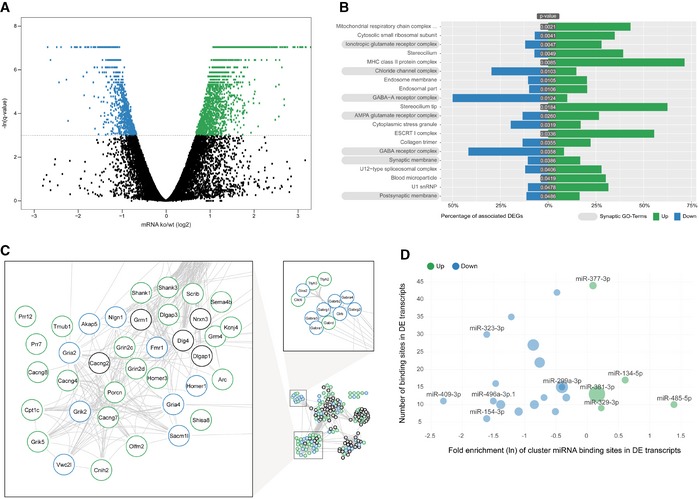
Figure 3. Coordinated upregulation of ionotropic glutamate receptor complexes in the miR379‐410 ko hippocampus.

- RNAseq differentially expressed gene (DEG) analysis in the adult hippocampus of miR379‐410 ko and wt mice. Upregulated (green) and downregulated (blue) DEGs are indicated by average changes in mRNA levels (ko/wt; log2) (n = 3; q‐values represent FDR‐corrected P‐values; q < 0.05); 2,170/898 genes were significantly up‐ and downregulated in miR379‐410 mice, respectively.
- GO term enrichment analysis of DEG reveals several synaptic cellular components (highlighted in grey). Green and blue bars indicate the percentage of significantly up‐ and downregulated genes associated with specific GO terms, respectively. GO terms with more than 300 annotated genes are not shown.
- String database protein–protein interaction network. The network is built including String‐DB parameters Experiments, Databases and Textmining. Clusters associated with synaptic transmission are enlarged (for the complete network, see Fig EV3B). Green and blue borders indicate significantly up‐ and downregulated genes, respectively.
- Enrichment analysis of cluster miRNA binding motifs (TargetScan v7.1). miRNAs overrepresented in differentially expressed (DE) transcripts are highlighted in green and blue, respectively. Shown is the natural logarithm (ln) of the wt/ko ratio of binding sites in DE transcripts. Bubble sizes correspond to RPM values in the mouse brain.
