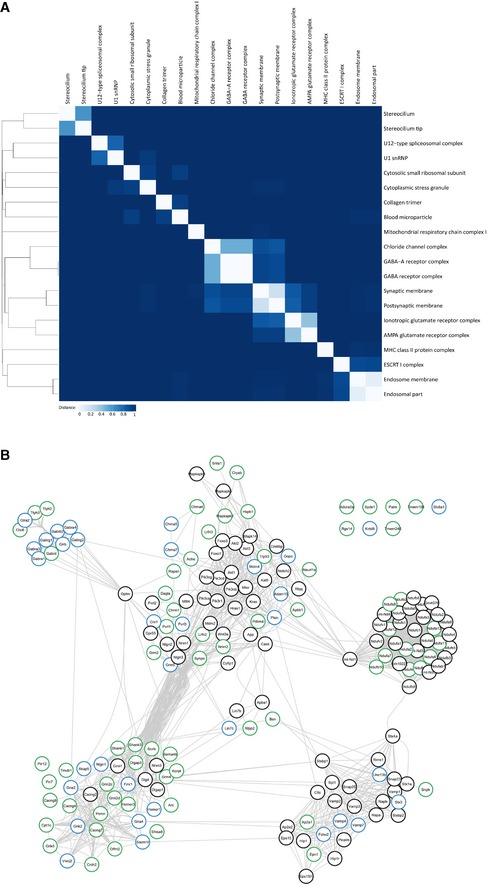
Figure EV3. Clustering of synaptic GO terms and String database protein–protein interaction network.

- Binary distance matrix of detected GO terms (cellular component). Hierarchical clustering has been performed by the unweighted pair group method with arithmetic mean. GO terms with more than 300 annotated genes are not shown.
- Complete String database protein–protein interaction network.
