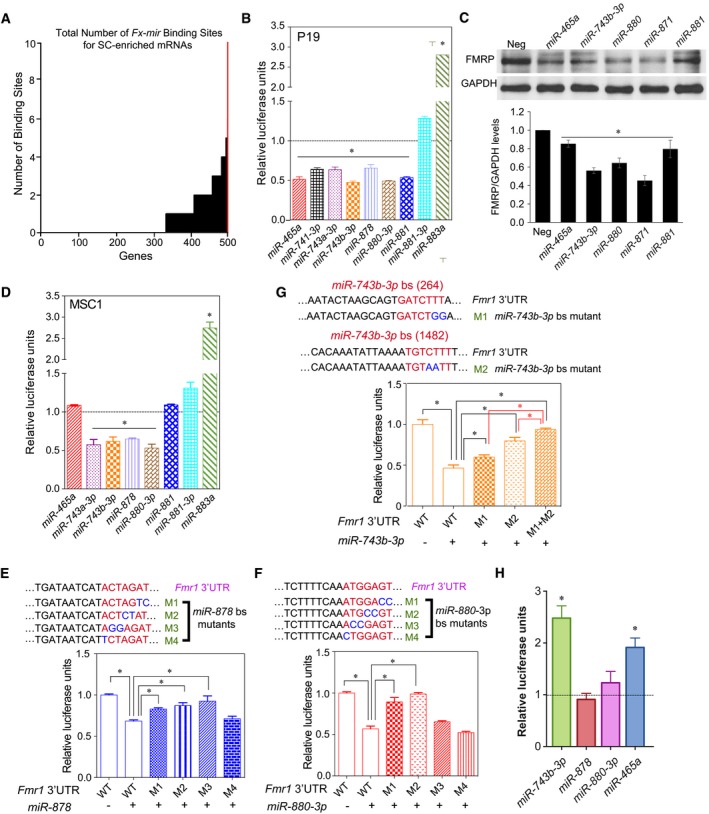
Figure 2. Mouse Fx‐mir family members directly regulate Fmr1 .

-
ANumber of Fx‐mir predicted binding sites in mouse SC‐enriched genes. The Y‐axis shows the number of binding sites predicted from microRNA.org target site predictions, and the X‐axis shows the number of genes targeted with 0–10 sites. The red line is Fmr1.
-
B–DLuciferase analysis of P19 cells (panel B) and MSC1 cells (panel D) co‐transfected with the pMIR‐luciferase reporter harboring the mouse Fmr1 3′UTR and the indicated Fx‐mir miRNA precursors. A Renilla luciferase vector was co‐transfected to normalize for transfection efficiency. The luciferase activity of cells transfected with a negative‐control scrambled precursor is set to 1. (C) Western blot analysis of endogenous FMRP protein levels in P19 cells transfected with respective Fx‐mir miRNAs or a negative‐control miRNA precursor. The bottom panel shows mean FMRP levels relative to the internal control (GAPDH).
-
E–GLuciferase analysis of MSC1 cells co‐transfected with (i) a miRNA precursor or a negative‐control scrambled miRNA precursor and (ii) the pMIR‐luciferase reporter with the wild‐type version of the mouse Fmr1 3′UTR or mutant versions with the indicated predicted miRNA‐binding site (bs) mutations. The seed sequences are depicted in red and the mutations are in blue. miR‐878 (panel E) and miR‐880 (panel F) have one major predicted binding sites, while miR‐743b‐3p (panel G) has three predicted binding sites, two of which were mutated, as described in the text. A Renilla luciferase vector was co‐transfected to normalize for transfection efficiency.
-
HLuciferase analysis of GS cells co‐transfected with the pMIR‐luciferase reporter harboring the mouse Fmr1 3′UTR and the indicated Fx‐mir miRNA competitors. The luciferase activity of cells transfected with a negative‐control scrambled competitor is set to 1.
