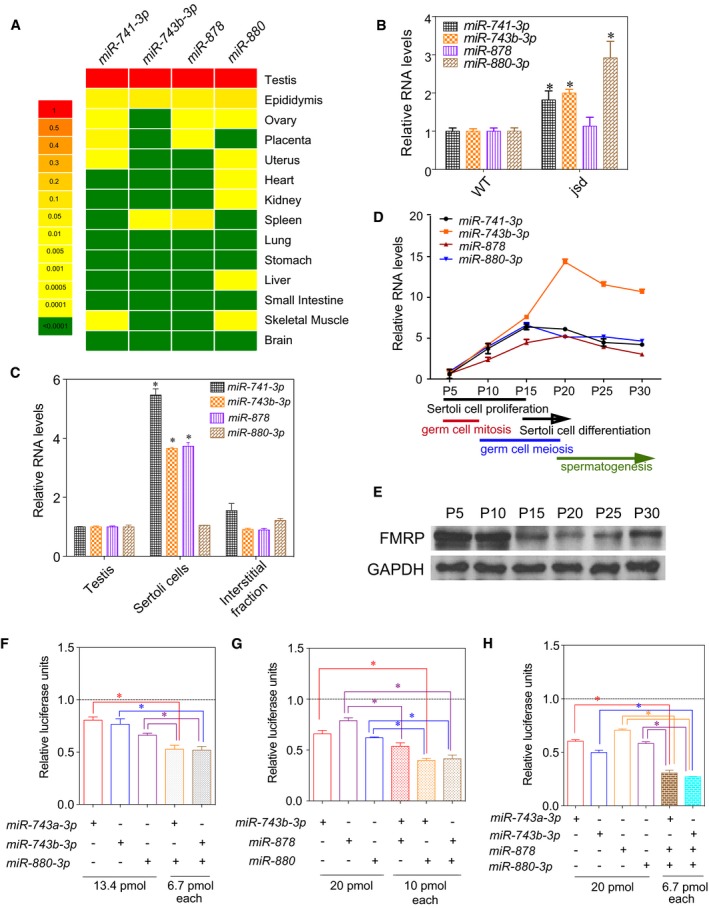
Figure 3. Developmentally regulated expression and additive action of mouse Fx‐mir family members.

-
AThe steady‐state levels of Fx‐mir miRNAs in the indicated adult mouse tissues, as assessed by TaqMan‐qPCR analysis. U6 levels were used to normalize miRNA values.
-
BTaqMan‐qPCR analysis of testes from three jsd mice and three control littermate mice. U6 snRNA levels were used for normalization.
-
CFx‐mir miRNA levels in total mouse testis and different testicular cell fractions assessed by TaqMan‐qPCR analysis. U6 snRNA levels were used for normalization.
-
DTaqMan‐qPCR analysis of testes from the indicated postnatal time points (n = 3 for each time point). U6 levels were used to normalize miRNA values.
-
EWestern blot analysis of mice testes from the indicated postnatal time points.
-
F–HLuciferase analysis of MSC1 cells co‐transfected with the pMIR‐luciferase reporter harboring the mouse Fmr1 3′UTR and the indicated Fx‐mir miRNAs (n = 3). The luciferase activity of cells transfected with a negative‐control scrambled precursor is set to 1. A Renilla luciferase vector was co‐transfected to normalize for transfection efficiency.
