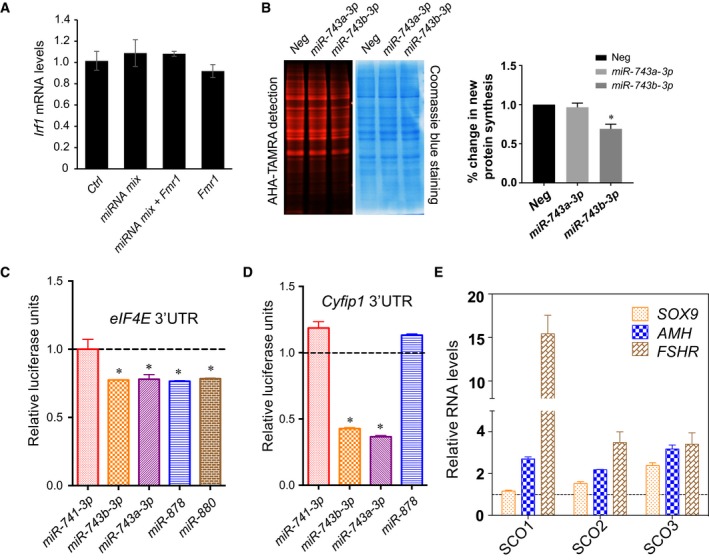
Figure EV5. Fx‐mir miRNAs regulate factors that form a translation regulatory complex.

- qPCR analyses of Irf1 in P19 cells transfected with Fx‐mir miRNA mix and/or Fmr1 overexpression (OE) vector. The mRNA values were normalized to L19. All values are relative to P19 cells co‐transfected with a scrambled miRNA precursor and OE empty vector, which is set to 1.
- miR‐743b‐3p reduces proteins synthesis. Left: P19 cells were transfected with negative‐control miRNAs or the indicated Fx‐mir precursor miRNAs 48 h prior to the addition of Click‐iT AHA in the culture medium. Newly synthesized proteins labeled with Click‐iT AHA were conjugated with the TAMRA and detected using 532 nm excitation. The gel was then stained with Coomassie Blue to assay protein loading. Right: % change in new protein synthesis.
- Fx‐mir miRNAs target Eif4e. Luciferase analysis of P19 cells co‐transfected with pMIR luciferase reporter harboring mouse Eif4e 3′UTR and the indicated Fx‐mir miRNAs or a scrambled miRNA precursor that served as control. miR‐741‐3p was used as a control to demonstrate specificity, as it does not have a predicted binding site in Eif4e 3′UTR. A Renilla luciferase vector was co‐transfected to normalize for transfection efficiency.
- Fx‐mir miRNAs target Cyfip1. Luciferase analysis of P19 cells co‐transfected with pMIR luciferase reporter harboring mouse Cyfip1 3′UTR and the indicated Fx‐mir miRNAs or a scrambled miRNA precursor that served as control. miR‐741‐3p and miR‐878 were to demonstrate specificity, as they do not have binding sites in Cyfip1 3′UTR. A Renilla luciferase vector was co‐transfected to normalize for transfection efficiency.
- SCO patient testes express elevated levels of Sertoli cell marker genes. qPCR analysis of SOX9, AMH, and FSHR (SC marker genes) in SCO patient samples was performed. The mRNA values were normalized to GAPDH, and the expression values from controls are considered as 1.
