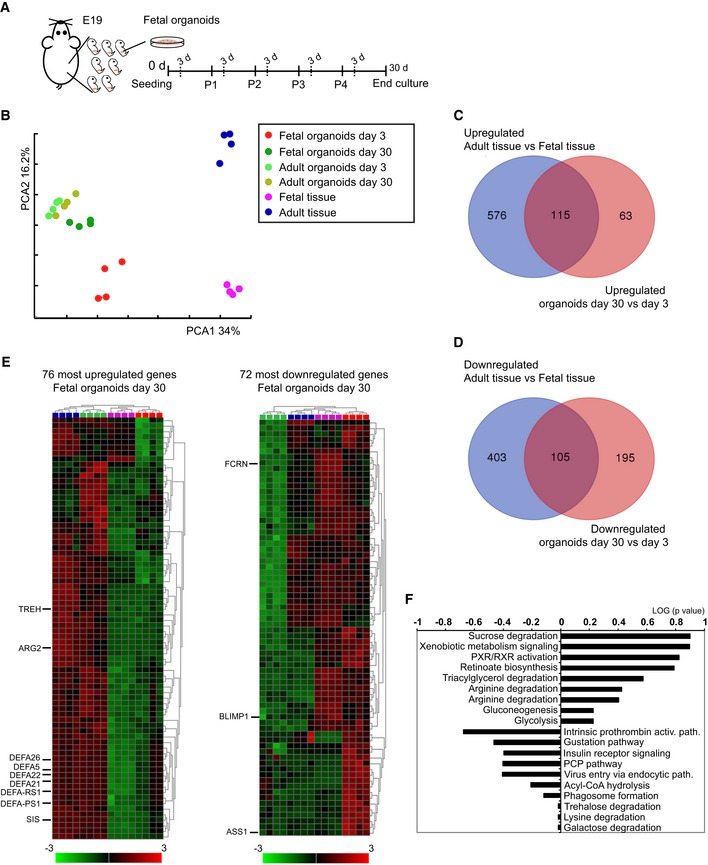
Figure 1. Gene expression analyses of E19 organoids at early and late culture time points.

-
AFetal organoids isolated from fetal intestine at embryonic day 19 were cultured for 30 days in ENR medium and analyzed 3 days after indicated passage.
-
BPCA was conducted on global gene activity in mouse fetal tissue at days 0 and 42, mouse E19 organoids at days 3 and 30 of culture, mouse adult organoids at days 3 and 30 of culture (n = 4 independent intestinal tissue specimens and n = 4 independent organoid cultures).
-
C, DLists of differentially expressed genes between adult and fetal tissue, days 3 and 30 organoids were generated for (C) up‐ and (D) downregulated genes. Results are shown as Venn diagram.
-
ECurated heat maps of top 76 up‐ and 72 downregulated genes. Highlighted genes were chosen based on biological interest. The colored bar represents the z‐score transformed expression level from low (green) to high (red).
-
FThe most significantly changed canonical pathways between fetal organoid at days 3 and 30 of culture.
