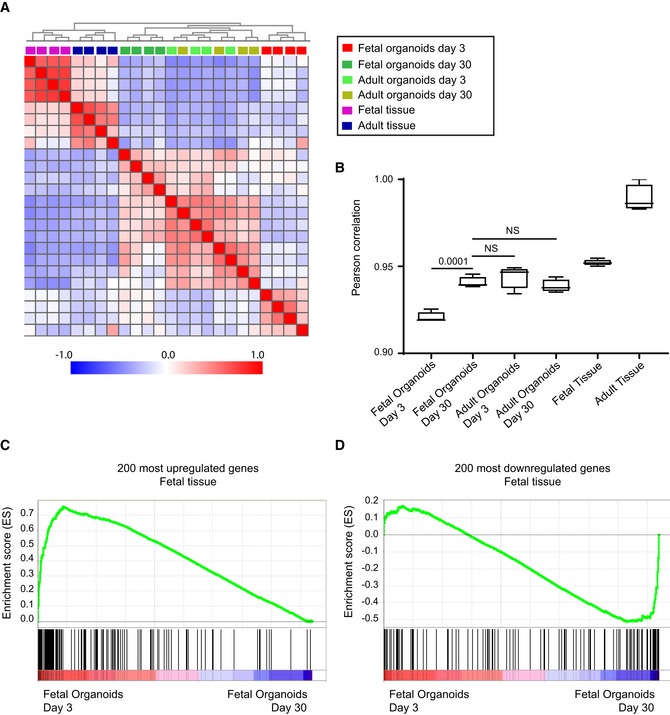
Figure EV1. Comparison of organoid with tissue maturation.

-
APearson's correlation matrix including hierarchical clustering for whole‐genome normalized microarray probes expressed in organoids/tissues indicated in the colored figure legend.
-
bPearson's correlation coefficient for the comparison of whole‐genome normalized microarray probes between each of the sample listed on the x‐axis and adult tissue. P‐values indicate the results of Student's t‐test. NS is not significant. n = 4.
-
C, DGene set enrichment analyses of 200 most (C) up‐ and (D) downregulated genes from mouse primary fetal versus adult epithelium (GSE35596) across fetal organoid maturation dataset. Vertical lines below x‐axis display relative distribution of expression per gene included in the geneset.
