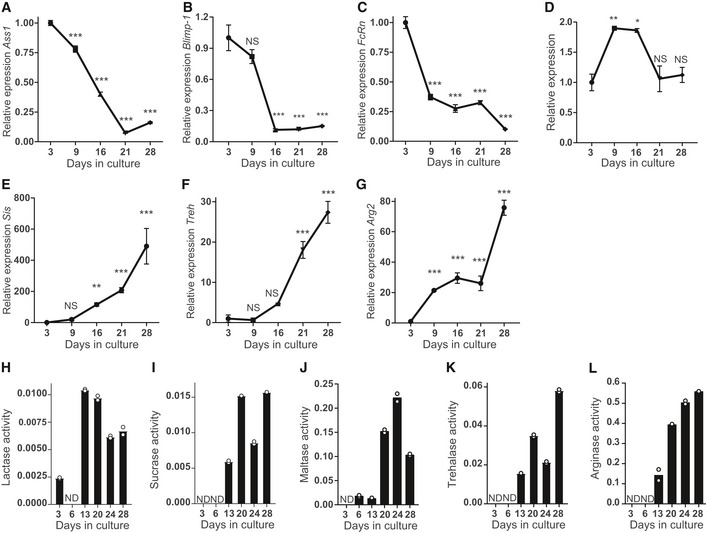
Figure 2. Small intestinal fetal organoids recapitulate suckling‐to‐weaning transition in vitro .

-
A–GReal‐time qPCR analysis of fetal organoids cultured for 1 month showing decrease in relative expression of indicated neonatal markers (A) Ass1, (B) Blimp‐1, (C) FcRn, and (D) Lct and increase in the adult markers (E) Sis, (F) Treh, and (G) Arg2 (n = 3 individual wells from single organoid culture (see Materials and Methods); experiment was repeated in four to eight independent organoid cultures with similar results).
-
H–LEnzyme activity assay of fetal organoids for (H) lactase, (I) sucrase, (J) maltase, (K) trehalase, and (L) arginase. Activity is given in μM glucose/μg protein/min (experiment was generated from single organoid culture (see Materials and Methods) and repeated in three independent organoid cultures with similar results).
