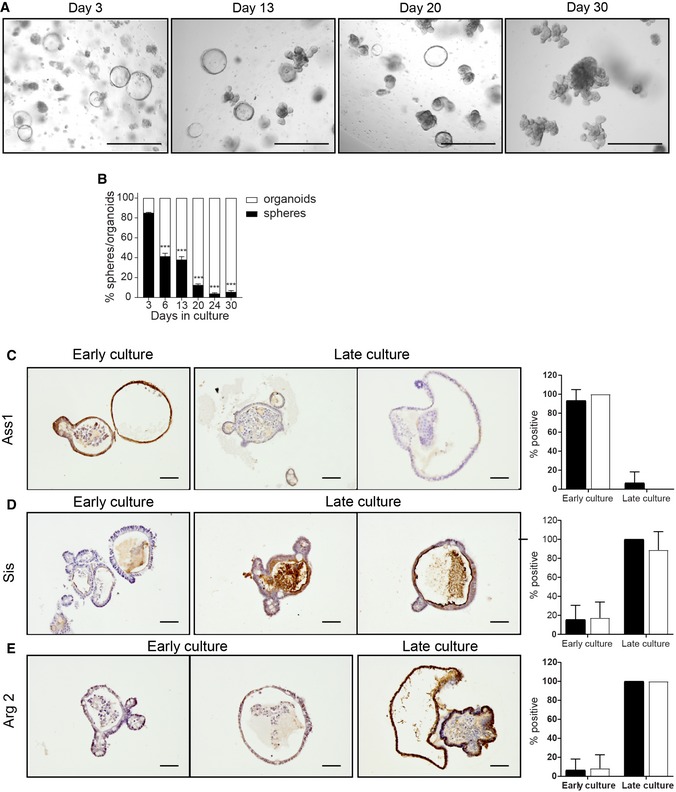
Figure 5. Spheroids and organoids show the same protein expression pattern, independently of culture stage/passage.

-
AMicroscopic images of fetal organoids at days 3, 13, 20, and 30 of culture. Scale bars: 500 μm.
-
BPercentage of fetal spheroids decreases during culture (n = 3 individual wells from single organoid culture (see Materials and Methods); experiment was repeated in ten independent organoid cultures with similar results).
-
C–EImmunohistochemistry of fetal organoids for (C) Ass1, (D) Sis, and (E) Arg2. Quantification of three slides per staining, 7–10 organoids/spheroids per slide. Scale bars: 50 μm.
