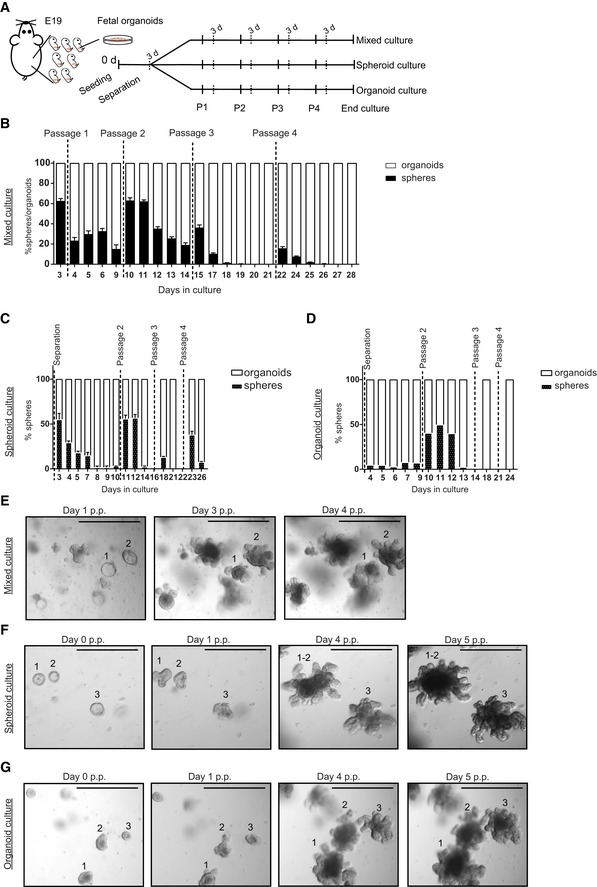
Figure EV5. Spheroid and organoid culture follow the same dynamics as mixed culture.

-
AScheme of culture separation.
-
B–DPercentage of spheroids versus organoids in (B) mixed culture, (C) spheroids, and (D) organoids (n = 3 individual wells from single organoid culture (see Materials and Methods); experiment was repeated four times with similar results).
-
EMicroscopic images of mixed culture at days 1, 3, and 4 post‐passage (p.p.), showing the transition of spheroids 1 and 2 into organoids between passage 1 and passage 2. Scale bars: 500 μm.
-
F, GMicroscopic images of (F) spheroid and (G) organoid culture at days 0, 1, 4, and 5 post‐passage (p.p.), showing the conversion of spheroids 1, 2, and 3 into organoids between passage 1 and passage 2. Scale bars: 500 μm.
