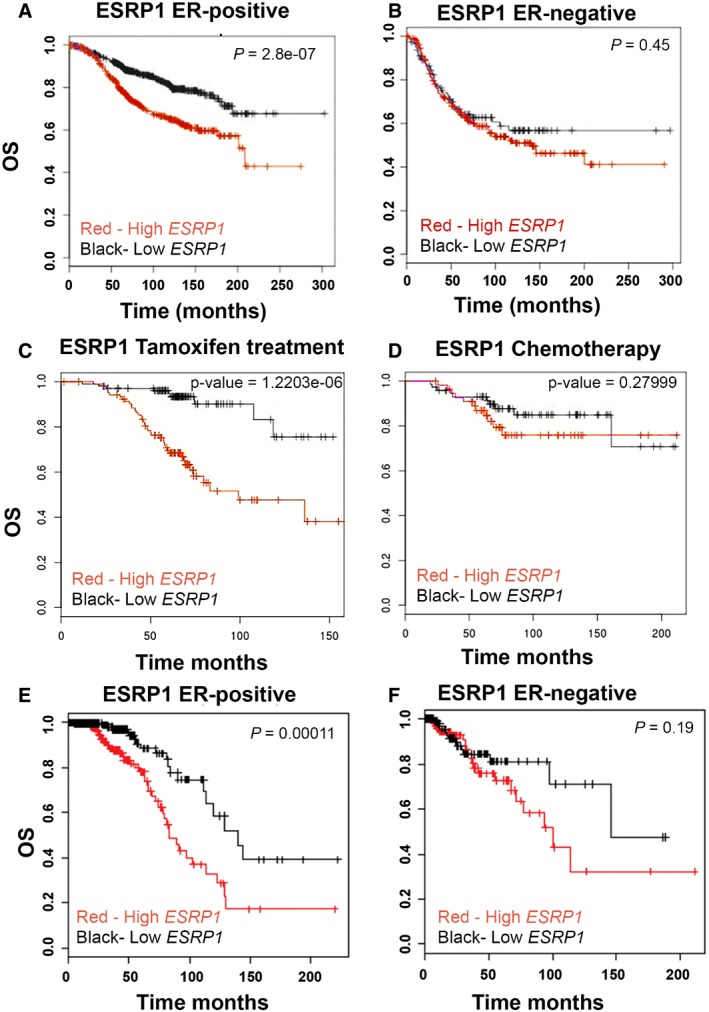
BreastMark microarray platform; Kaplan–Meier curves of overall survival (OS), demonstrating that high expression of ESRP1 (red line) is associated with poor prognosis in ER+ breast cancer. A log rank test was used to calculate P = 2.8 e‐07 (n = 934, number of events = 216).
BreastMark microarray platform; Kaplan–Meier curves of overall survival (OS) of ER− breast cancer. A log rank test was used to calculate P = 0.4481 (n = 322, number of events = 130).
BreastMark microarray platform; correlation of ESRP1 expression with overall survival in tamoxifen‐treated patients. A log rank test was used to calculate P = 1.218, e‐06 (n = 210, number of events = 49).
BreastMark microarray platform; correlation of ESRP1 expression with overall survival in chemotherapy‐treated patients. A log rank test was used to calculate the P = 0.28 (n = 129, number of events = 21)
The Cancer Genome Atlas Breast Invasive Carcinoma (TCGA‐BRCA) RNA‐Seq dataset; Kaplan–Meier curves of overall survival (OS) in ER+ breast cancer, demonstrating that high expression of ESRP1 (red line) is associated with poor prognosis in ER+ breast cancer. A log rank test was used to calculate P = 0.00011 (n = 656, number of events = 62).
The Cancer Genome Atlas Breast Invasive Carcinoma (TCGA‐BRCA) RNA‐Seq dataset; Kaplan–Meier curves of overall survival (OS) in ER− breast cancer. Red‐high ESRP1 expression; Black‐low ESRP1 expression. A log rank test was used to calculate P = 0.19 (n = 100, number of events = 17).