
Figure 2. Knockdown of ESRP1 decreases malignant and tumor growth significantly in endocrine‐resistant ER+ breast cancer models.
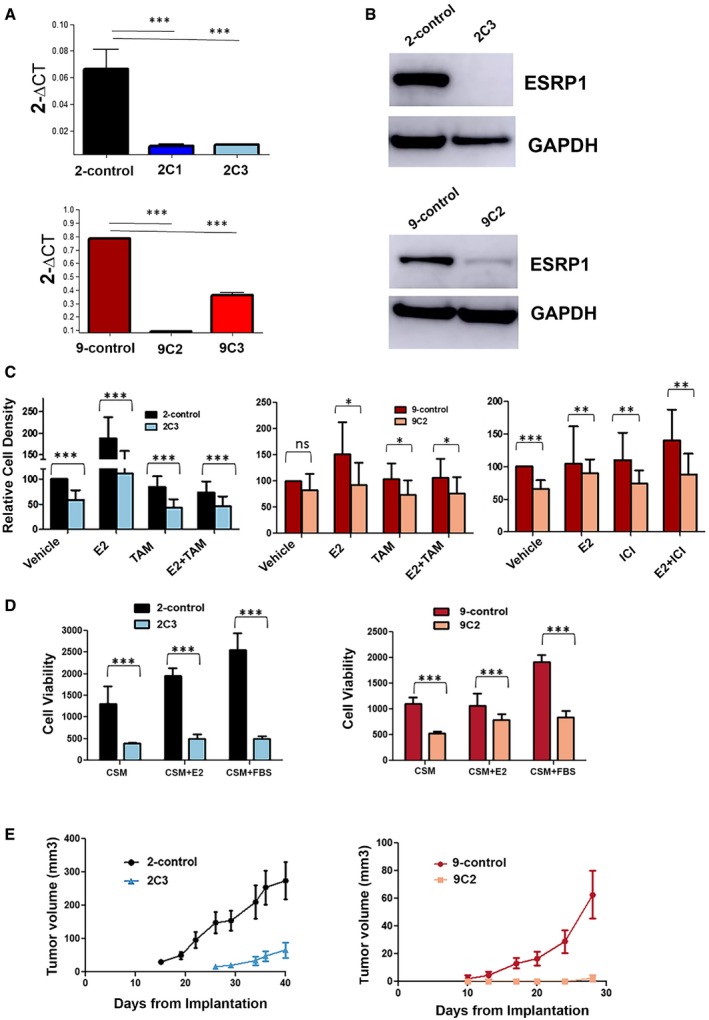
- RT–qPCR confirmed the stable knockdown of ESRP1 expression in endocrine‐resistant cells using a shRNA lentiviral system (Mission TRC human shRNA constructs‐Sigma); 2‐control (LCC2 cells transduced with pLKO.1 control vector) and 2C1 and 2C3 (LCC2 cells transduced with pLKO.1 shRNA ESRP1). Clones were selected for expression verification (clone 1 and clone 3); 9‐control (LCC9 cells transduced with pLKO.1 control vector), 9C2 and 9C3 (LCC9 cells transduced with pLKO.1 shRNA ESRP1). Clones were selected for expression verification (clone 2 and clone 3). * represents P < 0.05; statistically significant. Data (mean ± SD) were calculated using two‐way ANOVA based on three independent biological replicates.
- Western blot analysis using ESRP1 antibody GTX 131373 (GeneTex). GAPDH is used as the reference control.
- Relative cell density was determined by crystal violet assay. Cells were treated with TAM (4‐hydroxytamoxifen; 10−6 M) or ICI (ICI 182,780; 10−9 M) for 6 days in the presence and absence of E2 (β‐estradiol; 10−10 M). Data (mean ± SD) were calculated using two‐way ANOVA based on three independent biological replicates.
- Cell viability was determined using Cell Biolabs CytoSelect™ Cell Transformation Assay using 2‐control, 2C3, 9‐control, and 9C2 cells in CSM—charcoal‐stripped media, E2 (β‐estradiol; 10−10 M), and 10% fetal bovine serum. Data (mean ± SD) were calculated using two‐way ANOVA based on three independent biological replicates.
- Impact of ESRP1 knockdown on in vivo tumor growth. Five million cells (2‐control, 2C3, 9‐control, and 9C2) were implanted into mammary fat pads of athymic mice (five mice per group) in the presence of supplemental estrogen. Tumors were measured weekly using calipers for external measurements. Tumor volume was calculated as L × W2/2, where L is length and W is width (note the different scale for tumor volumes). Data (mean ± SD) were calculated using two‐way ANOVA (n = 5 mice per group).
Source data are available online for this figure.