
Figure EV2. ESRP1 expression in ER+ breast cancer cell lines at the mRNA and protein levels.
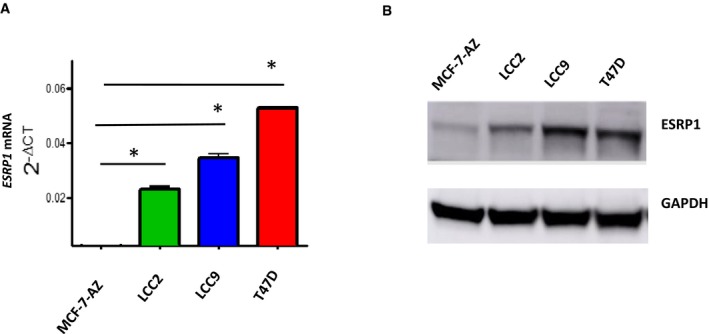
- RT–qPCR assay showing ESRP1 expression in endocrine‐resistant (MCF7/LCC2‐tamoxifen resistant, MCF7/LCC9‐fulvestrant and tamoxifen cross‐resistant) and T‐47D cells compared to parental MCF‐7‐AZ therapy‐sensitive cell lines. * represents P < 0.05; statistically significant. All RT–qPCR assays are performed in three independent biological replicates calculated using two‐way ANOVA (data (mean ± SD).
- Representative Western blot analysis of the indicated breast cancer cell lines (see details in Materials and Methods). All Western blot assays are performed in three independent biological replicates.
Source data are available online for this figure.