
Figure 5. Validation of the ASEs events of 10 EMT genes in response to ESRP1 knockdown using HTA 2.0 Splicing viewer (Transcriptome Analysis Console (TAC) Software‐Applied Biosystems/Thermo Fisher Scientific).
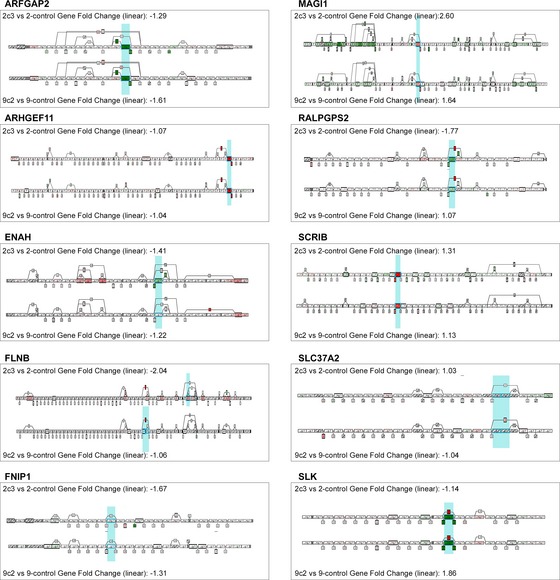
All Probe Selection Regions (PSRs) and Junctions are represented in the structural view with boxes that have the same size. An inclusion junction detects two neighboring PSRs. The PSRs detected by an inclusion junction are linked and graphically represented as dotted lines. An exclusion junction detects PSRs that are apart from each other. The PSRs detected by an exclusion junction are linked and graphically represented as dotted lines. Altered ASE for each corresponding gene has been highlighted as light blue representing the altered PSR. Red color indicates the inclusion of an exon, whereas green color represents the skipping of an exon. The blue column indicates the alternative splicing event at the listed location.Source data are available online for this figure.