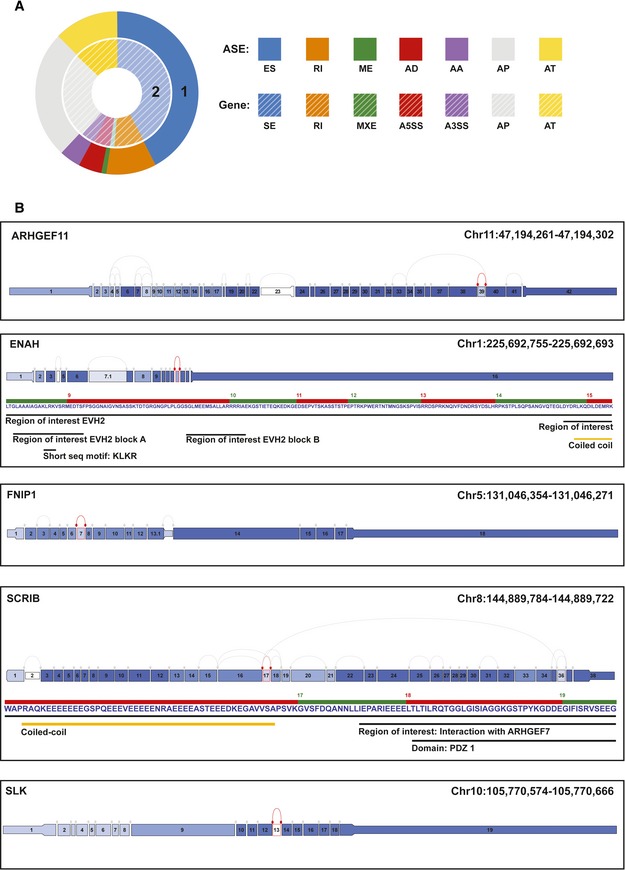
Figure 6. TCGA SpliceSeq analysis using BRCA dataset in ESRP1 high and ESRP1 low tumors.

- The data were analyzed by categorizing the splice events into seven types: exon skip (ES), alternative 5′ donor (AD), alternative 3′ acceptor (AA), retained intron (RI), mutually exclusive exons (ME), alternative first exon (AP), and alternative last exon (AT). The analysis of splice events was performed using the following filter criteria: Min Gene RPKM ≥ 2, |dPSI| ≥ 0.1, P ≤ 0.02, Min Group Obs % > 0.85; RPKM‐reads per kilobase of transcript per million aligned reads; and |dPSI|‐absolute changes in percent splicing (dPSI, ∆Ψ). The events are presented as differential expression of splice events between ESRP1low and ESRP1high cases.
- TCGA splice graphs for the EMT signature genes in ESRP1high versus ESRP1low tumors. A splice graph of the gene's exons is shaded based on the expression level and shows the selected splice event outlined in red.
Source data are available online for this figure.
