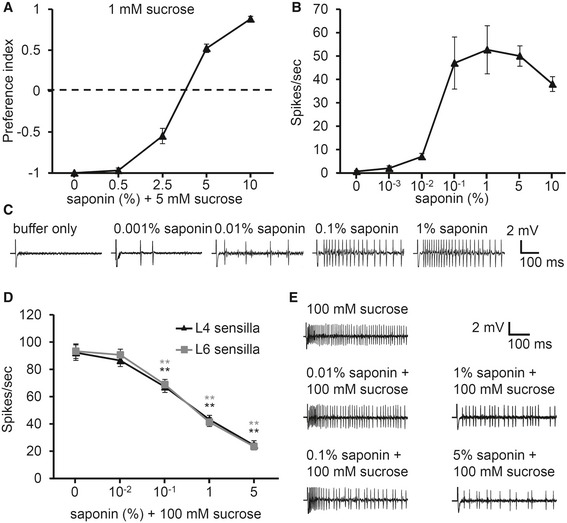
Dose–response binary food choice assay of saponin (n ≥ 4).
Dose–response curve of tip recordings using the indicated concentrations of saponin on S6 sensilla (n ≥ 8).
Sample traces of saponin‐induced action potentials in (B).
Dose–response curve for sugar inhibition using the indicated concentrations of saponin with 100 mM sucrose on L4 sensilla (n ≥ 8).
Sample traces from (D).
Data information: The asterisks indicate significant differences from that of the control detected by a single‐factor ANOVA with Scheffe's analysis as a
post hoc test to compare two sets of data (**
P < 0.01). The error bars represent SEMs.

