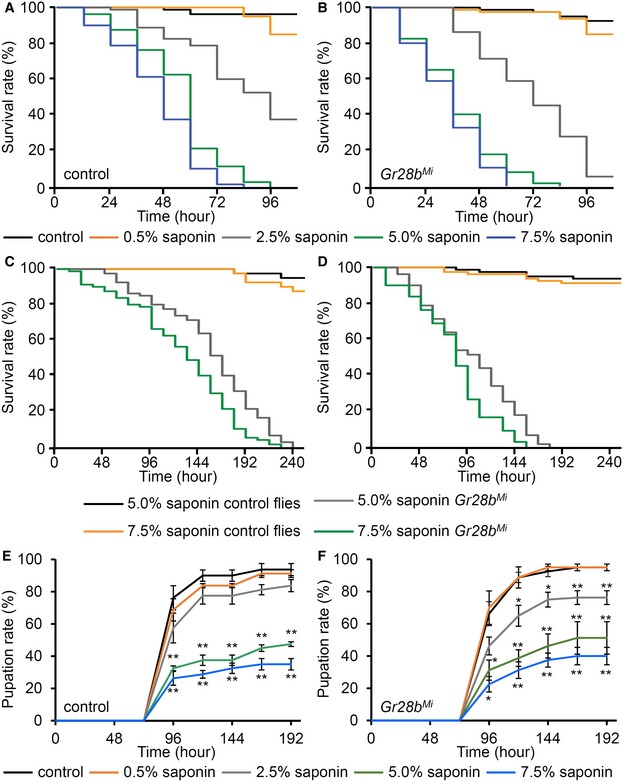
Figure 6. Saponin toxicity during adult stage and larval growth.

-
A, BSurvival rate of (A) control and (B) Gr28b Mi adult raised on control and the indicated concentrations of saponin‐containing cornmeal diet (n = 4). Statistics and LD50 are presented in Appendix Table S1.
-
C, DSurvival rate based on binary food choice. Control and Gr28b Mi were allowed to feed 100 mM fructose versus 100 mM (C) or 200 mM fructose (D) mixed with 5 or 7.5% saponin (n = 4). Statistics and LD50 are presented in Appendix Table S2.
-
E, FCumulative pupation rate of (E) control and (F) Gr28b Mi larvae raised on the indicated saponin‐containing food as well as control food (n = 4). The error bars represent SEMs. The asterisks indicate significant differences from normal diet fed, which were detected by a single‐factor ANOVA with Scheffe's analysis as a post hoc test to compare two sets of data (*P < 0.05, **P < 0.01).
