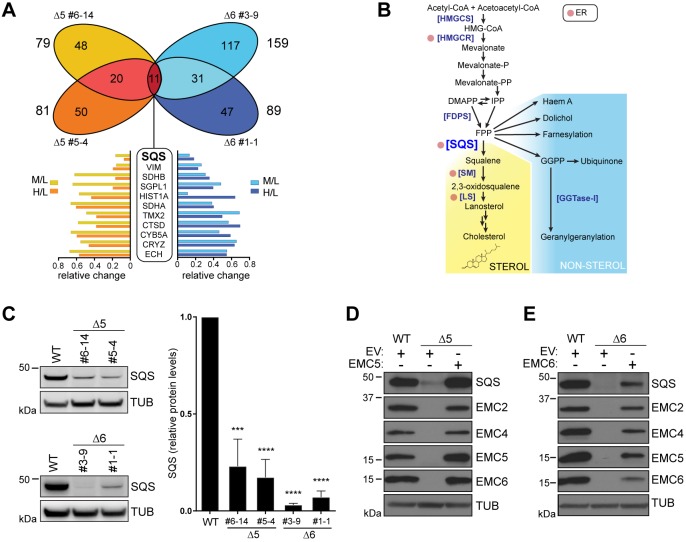
Fig. 5.
Loss of SQS expression from EMC-deficient cells. (A) Venn diagram representing proteins decreased by ≥30% in ΔEMC5 and ΔEMC6 cells in triple-label SILAC assays. Relative protein ratios of ΔEMC5 (Δ5 #5-4, Δ5 #6-14) and ΔEMC6 (Δ6 #1-1, Δ6 #3-9) U2OS Flp-In™ T-Rex™ cells labelled with deuterated heavy (H) or medium (M) amino acids were compared to WT cells (L) by tandem mass spectrometry. Proteins decreased by ≥30% in all knockout cell lines are indicated (boxed; gene names shown) with SQS highlighted (bold). The relative change of each candidate's signature peptides (M/L, H/L) is indicated below (bar graphs). (B) Schematic representation of the sterol and non-sterol isoprenoid biosynthesis pathways. ER-resident enzymes are indicated (red circle). Abbreviations from top to bottom: HMGCS, HMG-CoA synthase; HMGCR, HMG-CoA reductase; DMAPP, dimethylallyl pyrophosphate; IPP, isopentenyl pyrophosphate; FPP, farnesyl pyrophosphate; FDPS, FPP synthase; SQS, squalene synthase; SM, squalene monooxygenase; LS, lanosterol synthase; GGTase-I, geranylgeranyl transferase type I. (C) Validation of SQS loss in EMC-deficient cells. Left: western blots of whole-cell lysates (WCLs) from ΔEMC5 (Δ5) and ΔEMC6 (Δ6) cells used in A and probed for SQS. Right, densitometric analysis of SQS relative abundance normalised to WT. Means±s.d. are shown (n=3). ***P≤0.001, ****P≤0.0001 (Student's t-test). Reconstitution of Δ5 (D) and Δ6 cells (E) with empty vector control (EV), EMC5 or EMC6. Western blots of WCLs were probed with antibodies for SQS, EMC2, EMC4, EMC, EMC5, EMC6 and tubulin (TUB).

