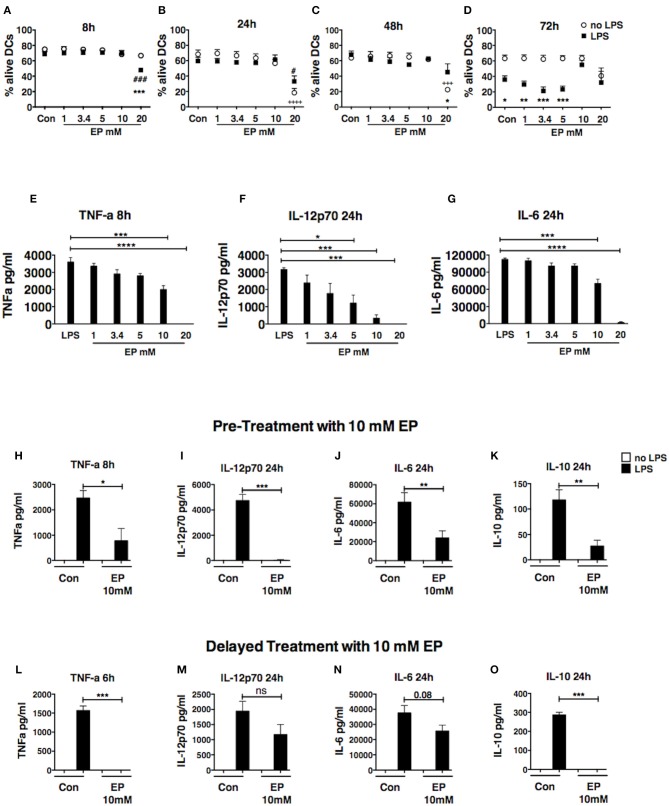
Figure 1.
Ethyl pyruvate (EP) dose titration response. Dose titration response to EP in DCs in presence or absence of 100 ng/ml LPS. EP was administered 1 h prior to LPS stimulation (A–D) DC viability. Cells were stained with AnnexinV and 7-AAD to assess viability by flow cytometry. Results are shown as percent Annexin V-7AAD double negative cells (alive) in the CD11c gate. Statistical significance was analyzed using One-way ANOVA followed by the Bonferroni multiple comparisons test and is shown by the symbols + between conditions in absence of LPS and the untreated control, and by the symbol # between conditions in presence of LPS and the LPS control. Statistical significance was also analyzed using Two-way ANOVA followed by the Sidak multiple comparisons test and is shown by the symbol * between conditions with and without LPS in presence of the same EP concentration (E–G) Cytokine production. Culture supernatants were analyzed by ELISA for levels of TNF-a at 8 h as well as IL-12p70 and IL-6 at 24 h post-LPS stimulation. Results are the average of 2 independent experiments with two biological replicates per experiment (n = 2, 4 data numbers). Data are shown as mean ± SEM. Statistical significance was analyzed using One-way ANOVA followed by the Bonferroni multiple comparisons test. (H–O) DCs were treated with 10mM EP either 1 h before (H–K) or 1 h after (L–O) LPS stimulation, and supernatants were analyzed for (H,L) TNF-a, (I,M) IL-12p70, (J,N) IL-6, (K,O) IL-10 by ELISA. Results are shown as mean ± SEM from 4 to 5 independent experiments (n = 4–5) (H–K) and 3 independent experiments (n = 3) (L–O). Data were analyzed using the two-tailed unpaired Student's t-test. P-values P < 0.05 were considered of statistical significance. *P < 0.05, **P < 0.01, ***P < 0.001, and ****P < 0.0001.

