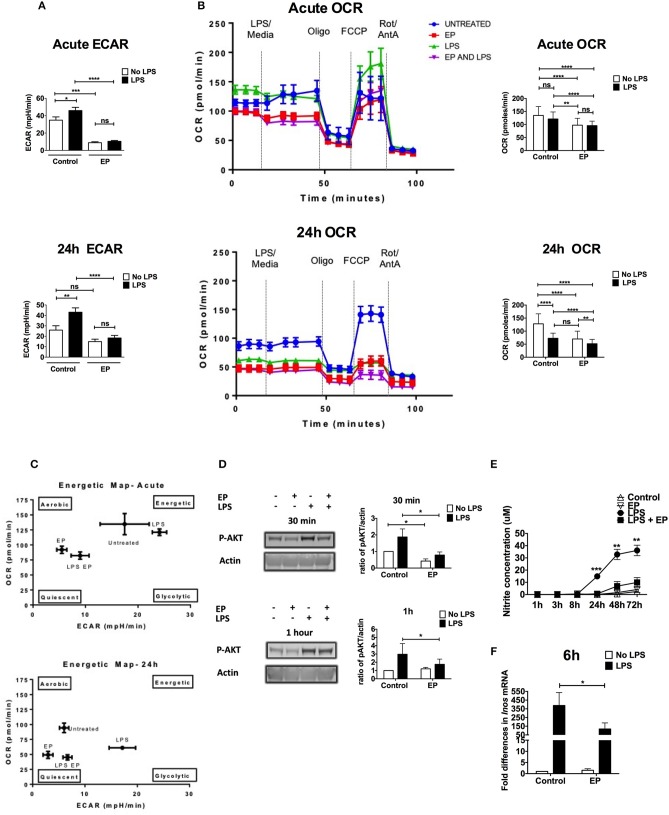
Figure 6.
EP alters DC metabolism by targeting AKT and NO. We performed metabolic assays on DCs pre-treated with EP (10mM) 1 h before LPS (100 ng/ml) stimulation. (A) ECAR measurements at the acute time point (30min after LPS addition or at rate 7 of the assay, also equivalent to 30min after the beginning of the seahorse run; top) and 24 h post-stimulation (24 h post-LPS addition is equivalent to rate 7 of the assay or 30min after the beginning of the seahorse run; bottom), before the addition of mitochondrial inhibitors. Results are the average of 4 independent experiments (n = 4). (B) OCR measurements. DCs were stimulated with LPS for 30min (measurements taken at rate 7 of the assay, also equivalent to 30min after the beginning of the seahorse run; top) and 24 h (equivalent to rate 7 of the assay or 30min after the beginning of the seahorse run; bottom), and OCR was measured as a response to mitochondrial inhibitors: 1 μM oligomycin, 1.5 μM fluorocarbonyl cyanide phenylhydrazone (FCCP), and 100 nM rotenone plus 1 μM antimycin A. Representative OCR plots are shown on the left and the average of 4 independent experiments on the right (n = 4). (C) Energetic maps of control and treatments at the acute (30min; top) and the 24 h (bottom) time points. (D) Cells were harvested at 30min and 1 h after LPS stimulation and AKT phosphorylation measured by western blotting. Densitometry was analyzed by calculating the ratio of p-AKT to actin. Results are plotted as change in ratio from the untreated control and are shown as mean ± SEM of 3 independent experiments (n = 3). No change in trend when compared to total AKT. (E) Supernatants were analyzed for nitrite concentration as a proxy for nitric oxide levels using the Griess reagent kit. (F) Total RNA was extracted from DCs to determine Inos level of expression by qRT-PCR 6 h post-LPS using the Ct method. Values were normalized to cyclophillin and expressed as fold difference in mRNA from untreated cells. Results are shown as mean ± SEM and are from 6 independent experiments for nitrite levels (n = 6) and from 3 independent experiments for Inos level of expression (n = 3). Data in (A,B,E) was analyzed using the two-tailed unpaired Student's t-test and in (B) using the ratio paired two-tailed Student's t-test. *P < 0.05, **P < 0.01, ***P < 0.001, and ****P < 0.0001.

