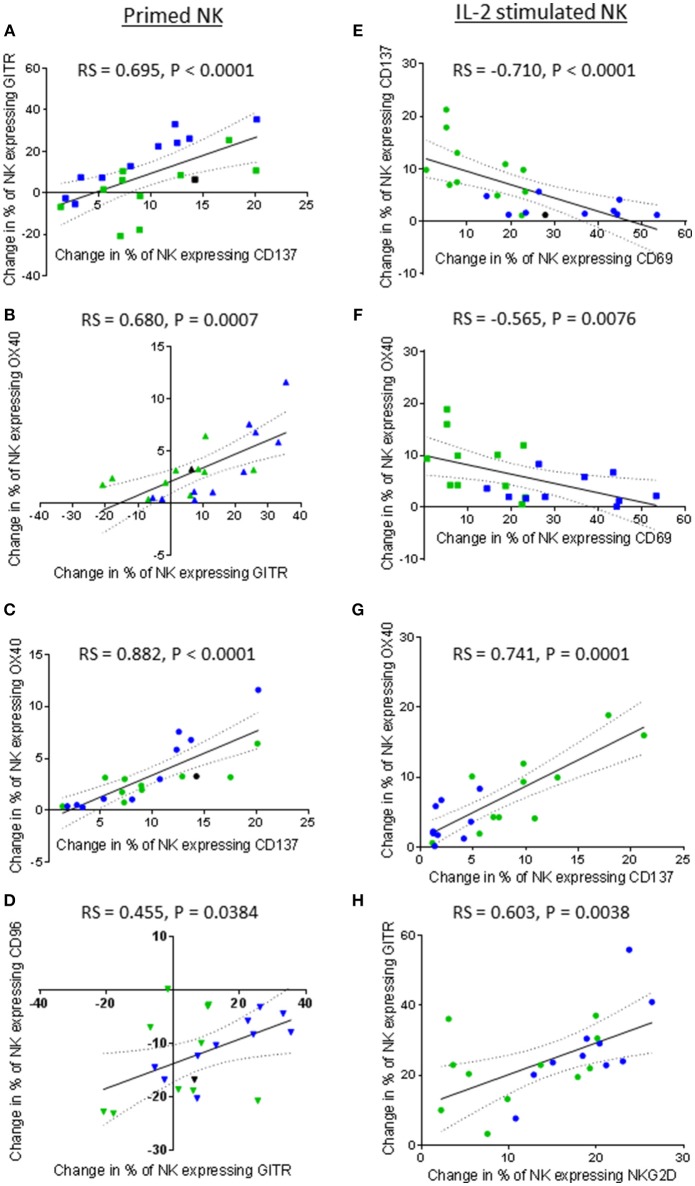
Figure 10.
Correlations between expression of TNF receptors, NKG2D, CD69, and CD96 by patient-derived NK cells after priming or IL-2 activation. Using phenotypic profiles from patients with prostate cancer, changes in the proportion of NK cells expressing each receptor after priming or activation with 100 U/ml IL-2 were calculated. Using these calculations, Spearman Rank correlation matrices for primed NK cells and IL-2 stimulated NK cells were used to identify correlations in expression of NK cell receptors. Graphical representations of significant correlations between pairs of receptors expressed by primed NK cells are shown; (A) CD137 vs. GITR, (B) GITR vs. OX40, (C) CD137 vs, OX40, (D) GITR vs. CD96. Graphical representations of significant correlations between pairs of receptors expressed by IL-2 stimulated NK cells are shown; (E) CD69 vs. CD137, (F) CD69 vs. OX40, (G) CD137 vs. OX40, (H) NKG2D vs. GITR. Green dots indicate patients whose NK cells responded better to IL-2 activation. Blue dots indicate patients whose NK cells responded better to being primed. Black dots indicate patients for which only priming experiments were done due to low NK cell numbers.

