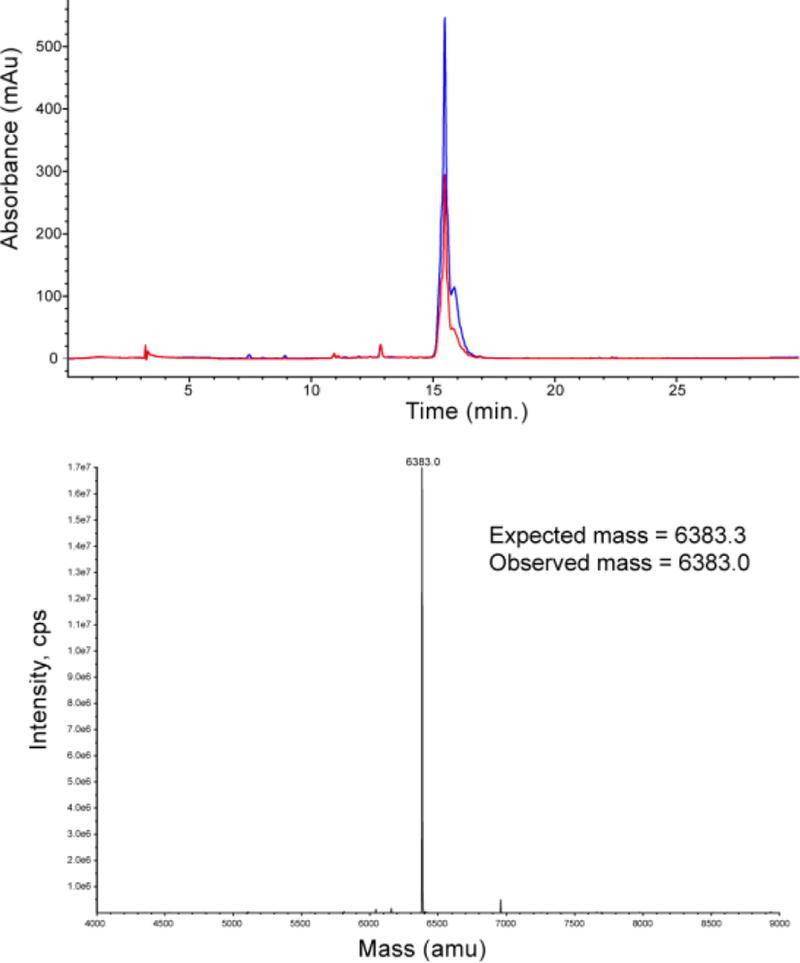
Figure 3. Characterization of P2-Insulin.

HPLC of purified P2-insulin, with chromatograms at 345nm and 280nm. Multiple peaks have similar ratios of 345 to 280, and are likely due to attachment at different insulin carboxyl groups. The deconvoluted mass reconstruction of the directly infused sample is shown below.
