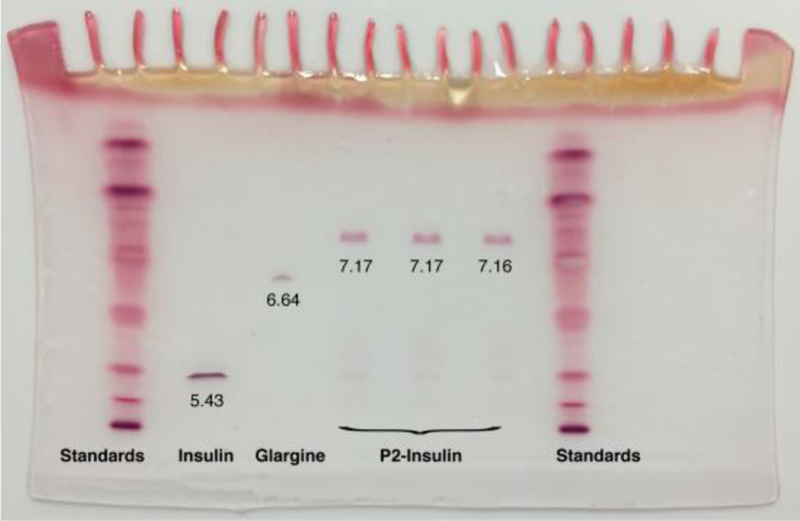
Figure 4. IEF Gel Analysis of P2-Insulin.

Lanes 1 and 7, pI standards. Lane 2, native insulin. Lane 3, insulin glargine. Lanes 4–6, triplicate samples of pure P2-insulin. Inset numbers indicate values of pI as determined from mobility of bands and standard curve plots of pI standards.
