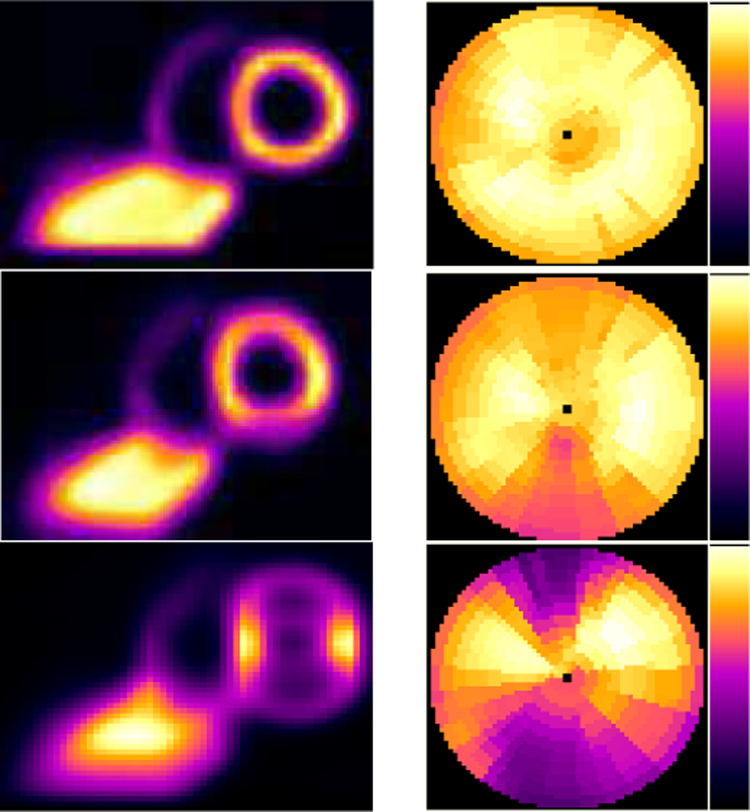
Fig. 17.
Simulated myocardial SPECT images demonstrating the effect of respiratory motion. (Left column). Same sample short-axis slice through the center of the heart. (Right column). From the 4D XCAT phantom (Top row) without respiratory motion, and with (Middle row) 2 cm and (Bottom row) 4 cm respiratory motion amplitude showing the increasing motion artifacts on the superior and inferior wall of the myocardium.

