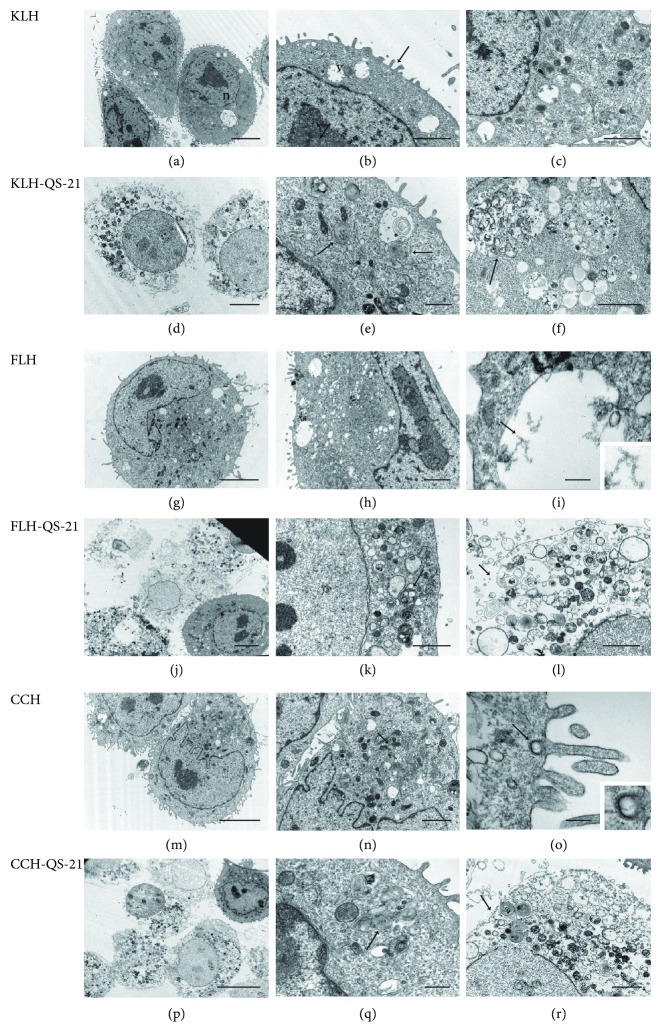
Figure 6.
Ultrastructural TEM analysis of MOC7 cells cultured with hemocyanins combined with QS-21. Transmission electron micrographs of MOC cells after 24 hours of incubation with hemocyanins alone or in combination with QS-21. The culture conditions are specified in Methods. (a) Cells incubated with KLH. Low-magnification image of the cells showing their normal appearance, i.e., an eccentric nucleus (n) and abundant cytoplasmic organelles. Scale bar represents 5 μm. (b) Details of the cytoplasm showing small, clear vacuoles (v); the surface of the cells with extended prolongations (arrow). Scale bar represents 2 μm. (c) Details of the cytoplasm. Scale bar represents 2 μm. (d) Cells incubated with KLH in combination with QS-21. Low-magnification image of the cells showing degenerative changes. Scale bar represents 2 μm. (e) Cytoplasm exhibiting vacuoles with multimembrane bodies. Scale bar represents 1 μm. (f) Details of vacuoles showing membranous and particulate contents. Scale bar represents 2 μm. (g) Cells incubated with FLH. Low-magnification image of a cell showing its normal appearance. Scale bar represents 5 μm. (h) Details of the cytoplasm. Scale bar represents 0.5 μm. (i) FLH molecules inside clear vacuoles. A higher-magnification inset image of hemocyanin molecules in the area is indicated with an arrow. Scale bar represents 0.2 μm. (j) Cells incubated with KLH in combination with QS-21. Scale bar represents 5 μm. (k) Low-magnification image of cells showing their cytoplasm with several multimembrane bodies. Scale bar represents 2 μm. (l) Details of a cytolyzed cell. Scale bar represents 2 μm. (m) Cells incubated with CCH. Low-magnification image of cells showing their normal appearance. Scale bar represents 5 μm. (n) Details of the cytoplasm showing profuse organelles. Scale bar represents 2 μm. (o) A coated vesicle containing CCH molecules. Higher-magnification inset image of hemocyanin molecules in the area, indicated with an arrow. Scale bar represents 0.2 μm. (p) Cells incubated with CCH in combination with QS-21. Low-magnification image of the cells showing their abnormal appearance. Scale bar represents 10 μm. (q) Cytoplasm showing vacuoles with multimembrane bodies. Scale bar represents 0.5 μm. (r) Details of a cytolyzed cell with a ruptured plasma membrane (arrow). Scale bar represents 2 μm.

