Figure 2.
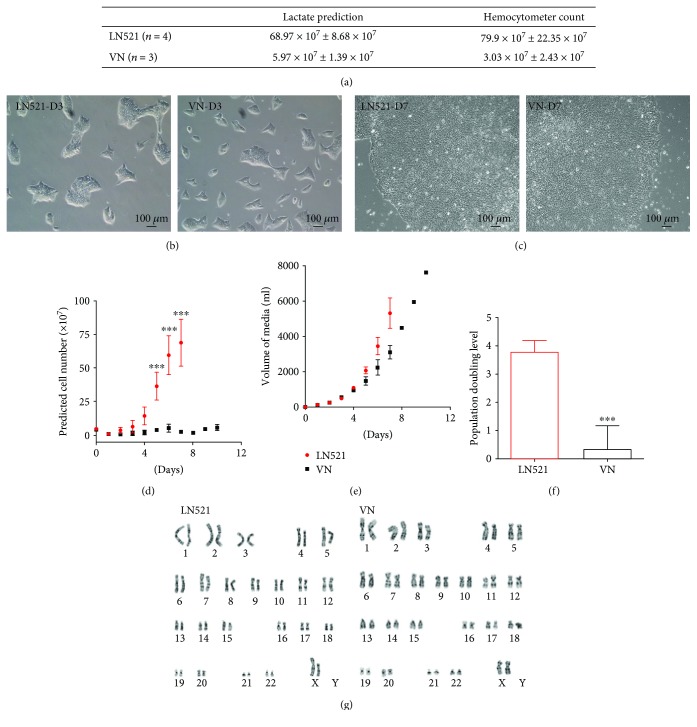
Human iPSC after expansion in the QES. (a) Comparison between predicted and counted cells harvested from the QES. (b, c) Bright field of iPSC cultivated in LN521 and VN 3 (b) and 7 (c) days after harvesting from the QES. (d) Lactate-predicted cell number during expansion in QES. (e) Media consumption during expansion in QES. (f) Population doubling level (PDL) of hiPSCs during QES expansion; red: LN521 coating (n = 4); black: vitronectin coating (n = 3). (g) Karyotyping of hiPSCs after expansion, ∗∗∗ p < 0.0001.

