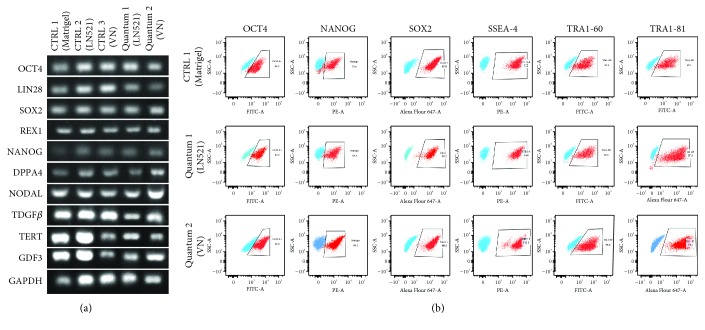
Figure 3.
Pluripotency characterization after QES expansion: (a) RT-PCR for pluripotency transcripts of cells cultivated on Matrigel (CTRL1), LN521 (CTRL2), and VN (CTRL3) both in 2D culture and after the QES expansion (quantum 1—LN521 and quantum 2—VN). GAPDH was used as endogenous control. (b) Representative dot plots of pluripotency markers after QES expansion: OCT4 (CTRL 1: 94.3%, quantum 1: 97.2%, quantum 2: 97.9%), NANOG (CTRL 1: 75.8%, quantum 1: 93.3%, quantum 2: 99.1%), SOX2 (CTRL 1: 99.9.%, quantum 1: 97.6%, quantum 2: 99.6%), SSEA4 (CTRL 1: 100%, quantum 1: 100%, quantum 2: 100%), TRA1-60 (CTRL 1: 97.1%, quantum 1: 97.6%, quantum 2: 98.6%), and TRA1-81 (CTRL 1: 99.3%, quantum 1: 97.5%, quantum 2: 99.7%). Blue represents isotype controls.

