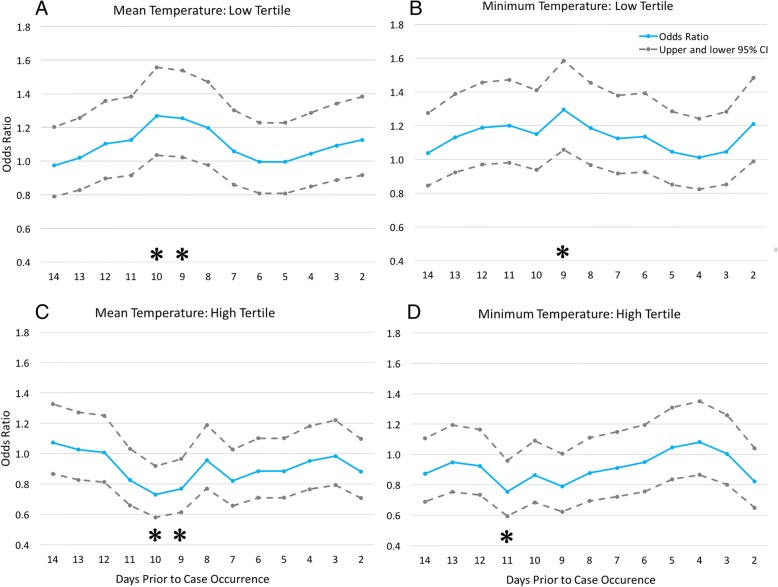
Fig. 4.
Daily mean and minimum temperature and risk of primary MERS by province in Saudi Arabia. Odds ratio (solid line) and 95% confidence limits (dashed lines) are plotted on the Y-axis, while time lags preceding case occurrence are plotted on the x-axis. The odds of primary MERS is increased with low temperature at 9 and 10 day lags (a &b), while the odds of primary MERS are decreased with high temperatures at 10 and 11 day lags (c & d). Asterisks indicate statistically significant odds ratios on corresponding days

