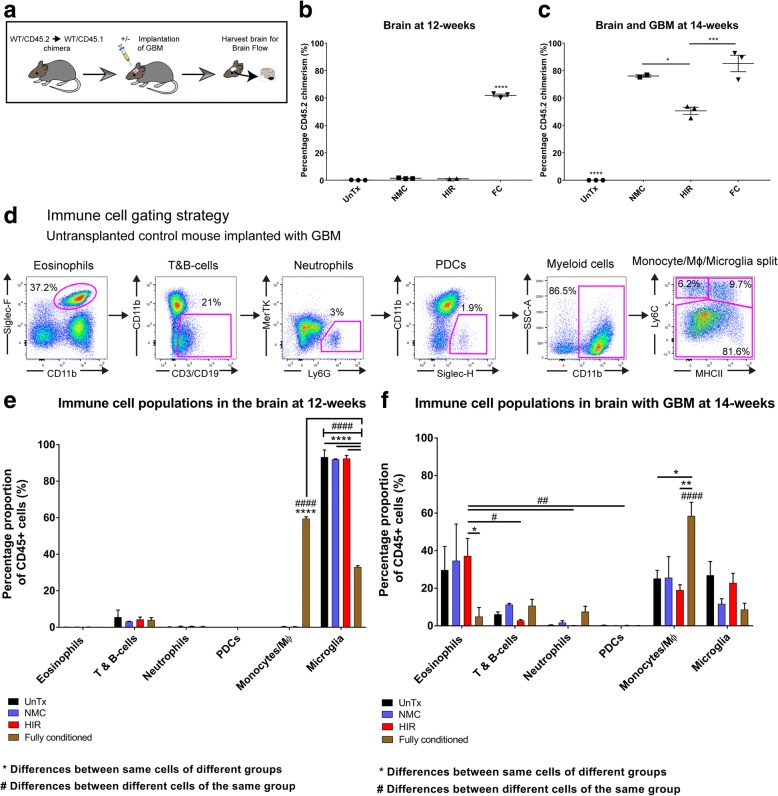
Fig. 3.
Brain immunophenotyping of different transplant groups with and without GBM. Brain immune cells were identified and quantified using flow cytometry. a Schematic diagram demonstrating how mouse brain samples in different groups were processed by brain digestion and flow cytometry with (n = 3/group) or without (n = 3/group) a brain tumour. b Naïve brain chimerism at 12 weeks, measured by calculating total CD45.2 cell engraftment. c Brain chimerism of mice implanted with GBM at 14 weeks, measured by calculating total CD45.2 engraftment. One-way ANOVA analysis with Tukey’s post hoc correction for multiple comparisons was used for all groups. Error bars represent the SEM. ****p < 0.0001; ***p < 0.001; *p < 0.05. d Gating strategy used to identify immune cell populations within the brain. e Immune cell profile, within the brain of different chimeric mice 12 weeks post-transplant (n = 3/group) without GBM. f Tumour-tropic immune cells found within the tumour-bearing hemisphere of different chimeric mice implanted with GBM (n = 3/group). Two-way ANOVA analysis with Tukey’s post hoc correction for multiple comparisons was used throughout. Error bar represents the SEM. **** or ####p < 0.0001; *** or ###p < 0.001; ** or ##p < 0.01; * or #p < 0.05; ns = non-significant. *Differences between the same type of immune cell amongst different transplant groups. #Differences between different immune cells within the same transplant group. One mouse from the NMC group was excluded due to reflux of tumour cells during surgery, thus providing unreliable downstream analysis

