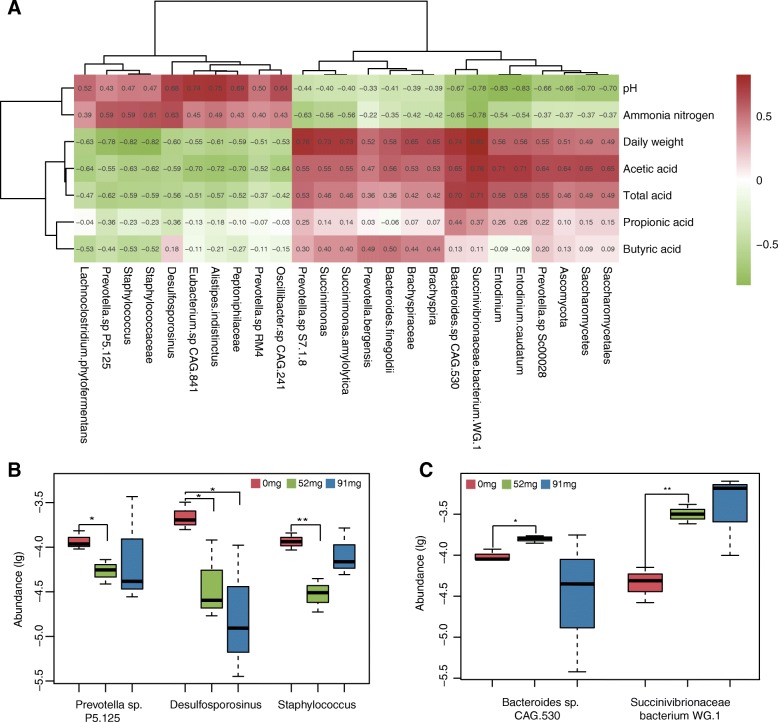
Fig. 4.
Correlations between production variables and relative taxa abundance. a Pearson’s correlation of the dominant bacteria across rumen samples. All presented correlations were statistically significant (P < 0.05), with strong correlations and weaker correlations indicated via shade. The scale colors denote whether the correlation was positive (closer to 1, green) or negative (closer to − 1, red) between the taxa and production variables. b & c Bacterial distribution in 0 mg, 52 mg and 91 mg EOC groups

